
Page 283 - Hydrogeology Principles and Practice
P. 283
HYDC07 12/5/05 5:32 PM Page 266
266 Chapter Seven
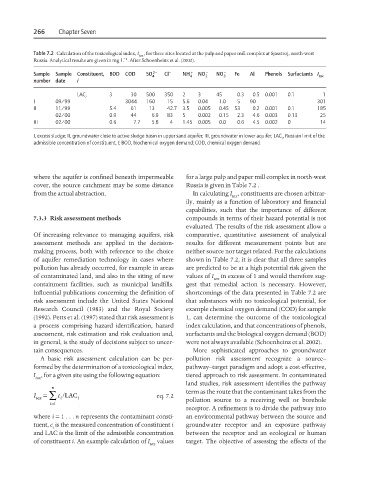
Table 7.2 Calculation of the toxicological index, I , for three sites located at the pulp and paper mill complex at Sjasstroj, north-west
tox
−1
Russia. Analytical results are given in mg L . After Schoenheinz et al. (2002).
Sample Sample Constituent, BOD COD SO 4 2− Cl − NH + 4 NO − 2 NO 3 − Fe Al Phenols Surfactants I tox
number date i
LAC i 3 30 500 350 2 3 45 0.3 0.5 0.001 0.1 1
I 09/99 3044 160 15 5.6 0.04 1.0 5 90 301
II 11/99 5.4 61 13 42.7 3.5 0.005 0.45 53 0.2 0.001 0.1 185
02/00 0.9 44 6.9 83 5 0.002 0.15 2.3 4.6 0.003 0.13 25
III 02/00 0.6 7.7 5.8 4 1.45 0.005 0.0 0.6 4.5 0.002 0 14
I, excess sludge; II, groundwater close to active sludge basin in upper sand aquifer; III, groundwater in lower aquifer; LAC , Russian limit of the
i
admissible concentration of constituent, I; BOD, biochemical oxygen demand; COD, chemical oxygen demand.
where the aquifer is confined beneath impermeable for a large pulp and paper mill complex in north-west
cover, the source catchment may be some distance Russia is given in Table 7.2 .
from the actual abstraction. In calculating I , constituents are chosen arbitrar-
tox
ily, mainly as a function of laboratory and financial
capabilities, such that the importance of different
7.3.3 Risk assessment methods compounds in terms of their hazard potential is not
evaluated. The results of the risk assessment allow a
Of increasing relevance to managing aquifers, risk comparative, quantitative assessment of analytical
assessment methods are applied in the decision- results for different measurement points but are
making process, both with reference to the choice neither source nor target related. For the calculations
of aquifer remediation technology in cases where shown in Table 7.2, it is clear that all three samples
pollution has already occurred, for example in areas are predicted to be at a high potential risk given the
of contaminated land, and also in the siting of new values of I in excess of 1 and would therefore sug-
tox
containment facilities, such as municipal landfills. gest that remedial action is necessary. However,
Influential publications concerning the definition of shortcomings of the data presented in Table 7.2 are
risk assessment include the United States National that substances with no toxicological potential, for
Research Council (1983) and the Royal Society example chemical oxygen demand (COD) for sample
(1992). Petts et al. (1997) stated that risk assessment is 1, can determine the outcome of the toxicological
a process comprising hazard identification, hazard index calculation, and that concentrations of phenols,
assessment, risk estimation and risk evaluation and, surfactants and the biological oxygen demand (BOD)
in general, is the study of decisions subject to uncer- were not always available (Schoenheinz et al. 2002).
tain consequences. More sophisticated approaches to groundwater
A basic risk assessment calculation can be per- pollution risk assessment recognize a source–
formed by the determination of a toxicological index, pathway–target paradigm and adopt a cost-effective,
I , for a given site using the following equation: tiered approach to risk assessment. In contaminated
tox
land studies, risk assessment identifies the pathway
n
tox ∑ term as the route that the contaminant takes from the
=
I c i /LAC i eq. 7.2
i=1 pollution source to a receiving well or borehole
receptor. A refinement is to divide the pathway into
where i = 1... n represents the contaminant consti- an environmental pathway between the source and
tuent, c is the measured concentration of constituent i groundwater receptor and an exposure pathway
i
and LAC is the limit of the admissible concentration between the receptor and an ecological or human
of constituent i. An example calculation of I values target. The objective of assessing the effects of the
tox