
Page 307 - Hydrogeology Principles and Practice
P. 307
HYDC08 12/5/05 5:31 PM Page 290
290 Chapter Eight
BO X
Continued
8.3
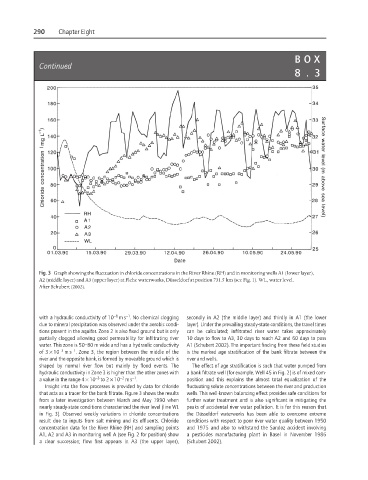
Fig. 3 Graph showing the fluctuation in chloride concentrations in the River Rhine (RH) and in monitoring wells A1 (lower layer),
A2 (middle layer) and A3 (upper layer) at Flehe waterworks, Düsseldorf at position 731.5 km (see Fig. 1). WL, water level.
After Schubert (2002).
−1
−8
with a hydraulic conductivity of 10 ms . No chemical clogging secondly in A2 (the middle layer) and thirdly in A1 (the lower
due to mineral precipitation was observed under the aerobic condi- layer). Under the prevailing steady-state conditions, the travel times
tions present in the aquifer. Zone 2 is also fixed ground but is only can be calculated; infiltrated river water takes approximately
partially clogged allowing good permeability for infiltrating river 10 days to flow to A3, 30 days to reach A2 and 60 days to pass
water. This zone is 50–80 m wide and has a hydraulic conductivity A1 (Schubert 2002). The important finding from these field studies
−1
−3
of 3 × 10 ms . Zone 3, the region between the middle of the is the marked age stratification of the bank filtrate between the
river and the opposite bank, is formed by moveable ground which is river and wells.
shaped by normal river flow but mainly by flood events. The The effect of age stratification is such that water pumped from
hydraulic conductivity in Zone 3 is higher than the other zones with a bank filtrate well (for example, Well 45 in Fig. 2) is of mixed com-
−1
−3
−2
a value in the range 4 × 10 to 2 × 10 ms . position and this explains the almost total equalization of the
Insight into the flow processes is provided by data for chloride fluctuating solute concentrations between the river and production
that acts as a tracer for the bank filtrate. Figure 3 shows the results wells. This well-known balancing effect provides safe conditions for
from a later investigation between March and May 1990 when further water treatment and is also significant in mitigating the
nearly steady-state conditions characterized the river level (line WL peaks of accidental river water pollution. It is for this reason that
in Fig. 3). Observed weekly variations in chloride concentrations the Düsseldorf waterworks has been able to overcome extreme
result due to inputs from salt mining and its effluents. Chloride conditions with respect to poor river water quality between 1950
concentration data for the River Rhine (RH) and sampling points and 1975 and also to withstand the Sandoz accident involving
A1, A2 and A3 in monitoring well A (see Fig. 2 for position) show a pesticides manufacturing plant in Basel in November 1986
a clear succession; flow first appears in A3 (the upper layer), (Schubert 2002).