
Page 316 - Hydrogeology Principles and Practice
P. 316
HYDC08 12/5/05 5:32 PM Page 299
Groundwater resources and environmental management 299
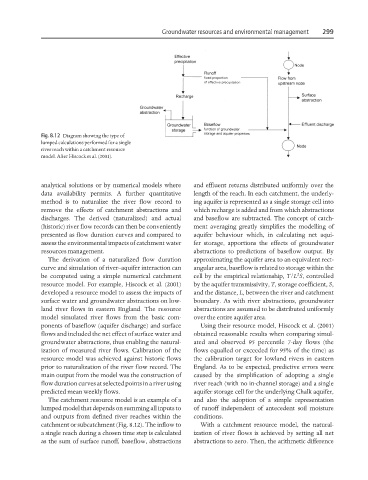
Fig. 8.12 Diagram showing the type of
lumped calculations performed for a single
river reach within a catchment resource
model. After Hiscock et al. (2001).
analytical solutions or by numerical models where and effluent returns distributed uniformly over the
data availability permits. A further quantitative length of the reach. In each catchment, the underly-
method is to naturalize the river flow record to ing aquifer is represented as a single storage cell into
remove the effects of catchment abstractions and which recharge is added and from which abstractions
discharges. The derived (naturalized) and actual and baseflow are subtracted. The concept of catch-
(historic) river flow records can then be conveniently ment averaging greatly simplifies the modelling of
presented as flow duration curves and compared to aquifer behaviour which, in calculating net aqui-
assess the environmental impacts of catchment water fer storage, apportions the effects of groundwater
resources management. abstractions to predictions of baseflow output. By
The derivation of a naturalized flow duration approximating the aquifer area to an equivalent rect-
curve and simulation of river–aquifer interaction can angular area, baseflow is related to storage within the
2
be computed using a simple numerical catchment cell by the empirical relationship, T/L S, controlled
resource model. For example, Hiscock et al. (2001) by the aquifer transmissivity, T, storage coefficient, S,
developed a resource model to assess the impacts of and the distance, L, between the river and catchment
surface water and groundwater abstractions on low- boundary. As with river abstractions, groundwater
land river flows in eastern England. The resource abstractions are assumed to be distributed uniformly
model simulated river flows from the basic com- over the entire aquifer area.
ponents of baseflow (aquifer discharge) and surface Using their resource model, Hiscock et al. (2001)
flows and included the net effect of surface water and obtained reasonable results when comparing simul-
groundwater abstractions, thus enabling the natural- ated and observed 95 percentile 7-day flows (the
ization of measured river flows. Calibration of the flows equalled or exceeded for 95% of the time) as
resource model was achieved against historic flows the calibration target for lowland rivers in eastern
prior to naturalization of the river flow record. The England. As to be expected, predictive errors were
main output from the model was the construction of caused by the simplification of adopting a single
flow duration curves at selected points in a river using river reach (with no in-channel storage) and a single
predicted mean weekly flows. aquifer storage cell for the underlying Chalk aquifer,
The catchment resource model is an example of a and also the adoption of a simple representation
lumped model that depends on summing all inputs to of runoff independent of antecedent soil moisture
and outputs from defined river reaches within the conditions.
catchment or subcatchment (Fig. 8.12). The inflow to With a catchment resource model, the natural-
a single reach during a chosen time step is calculated ization of river flows is achieved by setting all net
as the sum of surface runoff, baseflow, abstractions abstractions to zero. Then, the arithmetic difference