
Page 131 - Illustrated Pocket Dictionary of Chromatography
P. 131
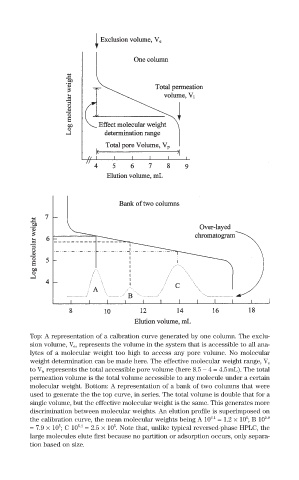
Top: A representation of a calbration curve generated by one column. The exclu-
        sion volume, V e, represents the volume in the system that is accessible to all ana-
        lytes of a molecular weight too high to access any pore volume. No molecular
        weight determination can be made here. The effective molecular weight range, V e
        to V i, represents the total accessible pore volume (here 8.5 - 4 = 4.5mL). The total
        permeation volume is the total volume accessible to any molecule under a certain
        molecular weight. Bottom: A representation of a bank of two columns that were
        used to generate the the top curve, in series. The total volume is double that for a
        single volume, but the effective molecular weight is the same. This generates more
        discrimination between molecular weights. An elution profile is superimposed on
                                                            6
        the calibration curve, the mean molecular weights being A 10 6.1  = 1.2 ¥ 10 ; B 10 5.9
                            5
               5
        = 7.9 ¥ 10 ; C 10 5.4  = 2.5 ¥ 10 . Note that, unlike typical reversed-phase HPLC, the
        large molecules elute first because no partition or adsorption occurs, only separa-
        tion based on size.