
Page 28 - Illustrated Pocket Dictionary of Chromatography
P. 28
C
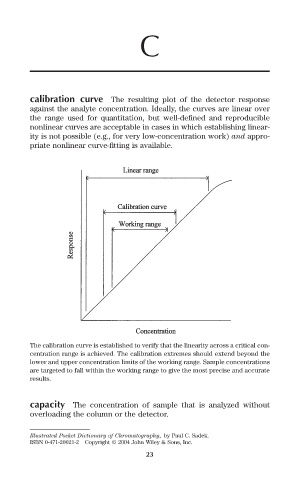
calibration curve The resulting plot of the detector response
against the analyte concentration. Ideally, the curves are linear over
the range used for quantitation, but well-defined and reproducible
nonlinear curves are acceptable in cases in which establishing linear-
ity is not possible (e.g., for very low-concentration work) and appro-
priate nonlinear curve-fitting is available.
The calibration curve is established to verify that the linearity across a critical con-
centration range is achieved. The calibration extremes should extend beyond the
lower and upper concentration limits of the working range. Sample concentrations
are targeted to fall within the working range to give the most precise and accurate
results.
capacity The concentration of sample that is analyzed without
overloading the column or the detector.
Illustrated Pocket Dictionary of Chromatography, by Paul C. Sadek.
ISBN 0-471-20021-2 Copyright © 2004 John Wiley & Sons, Inc.
23