
Page 10 - Industrial Process Plant Construction Estimating and Man Hour Analysis
P. 10
Introduction xxv
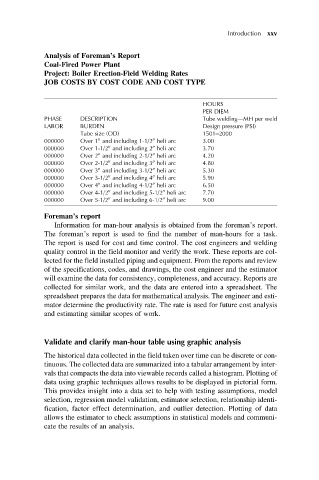
Analysis of Foreman’s Report
Coal-Fired Power Plant
Project: Boiler Erection-Field Welding Rates
JOB COSTS BY COST CODE AND COST TYPE
HOURS
PER DIEM
PHASE DESCRIPTION Tube welding—MH per weld
LABOR BURDEN Design pressure (PSI)
Tube size (OD) 1501–2000
000000 Over 1 and including 1-1/2 heli arc 3.00
00
00
00
00
000000 Over 1-1/2 and including 2 heli arc 3.70
000000 Over 2 and including 2-1/2 heli arc 4.20
00
00
00
00
000000 Over 2-1/2 and including 3 heli arc 4.80
00
00
000000 Over 3 and including 3-1/2 heli arc 5.30
00
00
000000 Over 3-1/2 and including 4 heli arc 5.90
00
000000 Over 4 and including 4-1/2 heli arc 6.50
00
00
00
000000 Over 4-1/2 and including 5-1/2 heli arc 7.70
000000 Over 5-1/2 and including 6-1/2 heli arc 9.00
00
00
Foreman’s report
Information for man-hour analysis is obtained from the foreman’s report.
The foreman’s report is used to find the number of man-hours for a task.
The report is used for cost and time control. The cost engineers and welding
quality control in the field monitor and verify the work. These reports are col-
lected for the field installed piping and equipment. From the reports and review
of the specifications, codes, and drawings, the cost engineer and the estimator
will examine the data for consistency, completeness, and accuracy. Reports are
collected for similar work, and the data are entered into a spreadsheet. The
spreadsheet prepares the data for mathematical analysis. The engineer and esti-
mator determine the productivity rate. The rate is used for future cost analysis
and estimating similar scopes of work.
Validate and clarify man-hour table using graphic analysis
The historical data collected in the field taken over time can be discrete or con-
tinuous. The collected data are summarized into a tabular arrangement by inter-
vals that compacts the data into viewable records called a histogram. Plotting of
data using graphic techniques allows results to be displayed in pictorial form.
This provides insight into a data set to help with testing assumptions, model
selection, regression model validation, estimator selection, relationship identi-
fication, factor effect determination, and outlier detection. Plotting of data
allows the estimator to check assumptions in statistical models and communi-
cate the results of an analysis.