
Page 11 - Industrial Process Plant Construction Estimating and Man Hour Analysis
P. 11
xxvi Introduction
The graph is a pictorial illustration of the relationship between variables:
Y ¼ a + bx; Y ¼ a+ y y1Þ= x x1Þ xðÞ
ð
ð
where
Y¼dependent variable
a¼intercept value along the y-axis at x¼0
b¼slope, or the length of the rise divided by the length of the run
b¼(y y1)/(x x1)
x¼independent or control variable
Illustrative example of graphic analysis of data for boiler field tube welding
Foreman’s Report
Project: Boiler Erection-Field Tube Welding
Foreman: John Smith Date: June 00, 0000
Craft: Boilermaker Tube Welding—MH per Weld
Cost code Phase code description Design pressure (PSI)
Tube size (OD) 1501–2000
000000 1.5 3.00
000000 2 3.70
000000 2.5 4.20
000000 3 4.80
000000 3.5 5.30
000000 4 5.90
000000 4.5 6.50
000000 5.5 7.70
000000 6.5 9.00
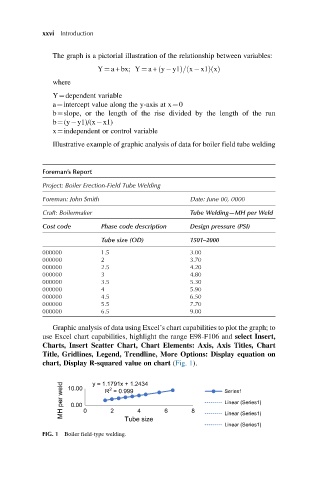
Graphic analysis of data using Excel’s chart capabilities to plot the graph; to
use Excel chart capabilities, highlight the range E98-F106 and select Insert,
Charts, Insert Scatter Chart, Chart Elements: Axis, Axis Titles, Chart
Title, Gridlines, Legend, Trendline, More Options: Display equation on
chart, Display R-squared value on chart (Fig. 1).
MH per weld 10.00 0 y = 1.1791x + 1.2434 6 8 Series1
2
R = 0.999
Linear (Series1)
0.00
2
4
Linear (Series1)
Tube size
Linear (Series1)
FIG. 1 Boiler field-type welding.