Page 12 - Industrial Process Plant Construction Estimating and Man Hour Analysis
P. 12

Introduction xxvii


                                               2
                The coefficient of determination, R , is exactly +1 and indicates a
             positive fit.
                All data points lie exactly on the straight line.
                The relationship between X and Y variables is such that as X increases,
             Y also increases.


             Boiler tube welding
             Field tube welding

             Facility—boiler
                                              Tube welding—MH per weld
             x                                y
             Tube size (OD)                   Design pressure (PSI)      Bins

                                              1501–2000
             Over 1 and including 1-1/2 heli arc  3.00                   0.11
                  00
                                00
             Over 1-1/2 and including 2 heli arc  3.70                   0.12
                    00
                                00
             Over 2 and including 2-1/2 heli arc  4.20                   0.30
                  00
                                00
             Over 2-1/2 and including 3 heli arc  4.80                   0.49
                    00
                                00
             Over 3 and including 3-1/2 heli arc  5.30                   0.60
                                00
                  00
                    00
             Over 3-1/2 and including 4 heli arc  5.90
                                00
                  00
                                00
             Over 4 and including 4-1/2 heli arc  6.50
                                   00
             Over 4-1/2 and including 5-1/2 heli arc  7.70
                    00
                                   00
                    00
             Over 5-1/2 and including 6-1/2 heli arc  9.00
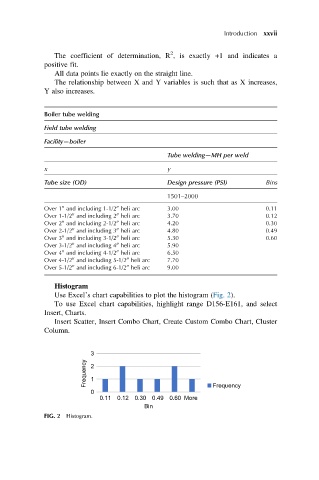
                Histogram
                Use Excel’s chart capabilities to plot the histogram (Fig. 2).
                To use Excel chart capabilities, highlight range D156-E161, and select
             Insert, Charts.
                Insert Scatter, Insert Combo Chart, Create Custom Combo Chart, Cluster
             Column.
                          3
                        Frequency  2 1
                          0                                Frequency
                            0.11  0.12  0.30 0.49 0.60 More
                                        Bin
             FIG. 2 Histogram.
   7   8   9   10   11   12   13   14   15   16   17