
Page 15 - Industrial Process Plant Construction Estimating and Man Hour Analysis
P. 15
xxx Introduction
Illustrative example of regression analysis and correlation of data for
generating bank tube installation… Verify and clarify man-hour table
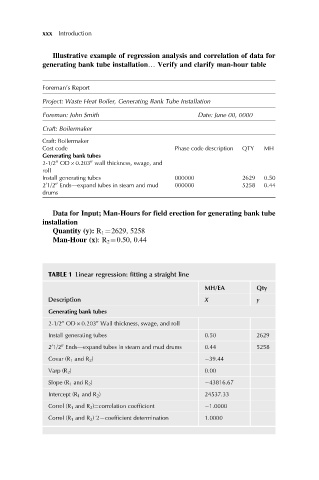
Foreman’s Report
Project: Waste Heat Boiler, Generating Bank Tube Installation
Foreman: John Smith Date: June 00, 0000
Craft: Boilermaker
Craft: Boilermaker
Cost code Phase code description QTY MH
Generating bank tubes
2-1/2 OD 0.203 wall thickness, swage, and
00
00
roll
Install generating tubes 000000 2629 0.50
00
2 1/2 Ends—expand tubes in steam and mud 000000 5258 0.44
0
drums
Data for Input; Man-Hours for field erection for generating bank tube
installation
Quantity (y): R 1 ¼2629, 5258
Man-Hour (x):R 2 ¼0.50, 0.44
TABLE 1 Linear regression: fitting a straight line
MH/EA Qty
Description X y
Generating bank tubes
2-1/2 OD 0.203 Wall thickness, swage, and roll
00
00
Install generating tubes 0.50 2629
2 1/2 Ends—expand tubes in steam and mud drums 0.44 5258
0
00
Covar (R 1 and R 2 ) 39.44
Varp (R 2 ) 0.00
Slope (R 1 and R 2 ) 43816.67
Intercept (R 1 and R 2 ) 24537.33
Correl (R 1 and R 2 )¼correlation coefficient 1.0000
Correl (R 1 and R 2 )^2¼coefficient determination 1.0000