
Page 109 - Industrial Ventilation Design Guidebook
P. 109
74 CHAPTER 4 PHYSICAL FUNDAMENTALS
4.2.5 Construction of a Mollier Diagram
Properties of humid air are usually described by means of the Mollier dia-
gram. The Mollier diagram is constructed for a certain air pressure, normally
for the value
which is the so-called standard atmosphere pressure. As suggested in Exam-
ples 1 and 2, a Mollier diagram can be used only when the total pressure is
the same or almost the same as the pressure for which the diagram was
constructed.
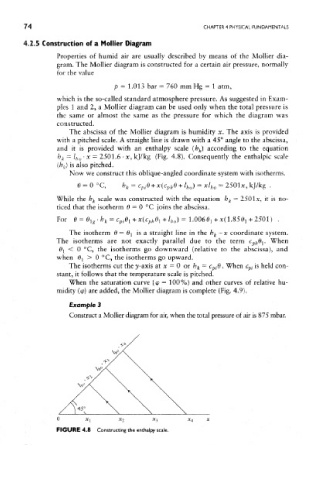
The abscissa of the Mollier diagram is humidity x. The axis is provided
with a pitched scale. A straight line is drawn with a 45° angle to the abscissa,
and it is provided with an enthalpy scale (h k) according to the equation
h k = l ho • x = 2501.6 • x, kj/kg (Fig. 4.8). Consequently the enthalpic scale
(h k) is also pitched.
Now we construct this oblique-angled coordinate system with isotherms.
While the h k scale was constructed with the equation h k - 2501 x, it is no-
ticed that the isotherm 6 = 0 °C joins the abscissa.
The isotherm 0 = ^ is a straight line in the h k -x coordinate system.
The isotherms are not exactly parallel due to the term c phQ l. When
QI < 0 °C, the isotherms go downward (relative to the abscissa), and
when Q l > 0 °C, the isotherms go upward.
The isotherms cut the y-axis at x — 0 or b k = c pi&. When c pl is held con-
stant, it follows that the temperature scale is pitched.
When the saturation curve (<p = 100%) and other curves of relative hu-
midity (<p) are added, the Mollier diagram is complete (Fig. 4.9).
Example 3
Construct a Mollier diagram for air, when the total pressure of air is 875 mbar.
FIGURE 4.8 Constructing the enthalpy scale.