
Page 112 - Industrial Ventilation Design Guidebook
P. 112
4.2 STATE VALUES OF HUMID AIR; MOLLIER DIAGRAMS AND THEIR APPLICATIONS 77
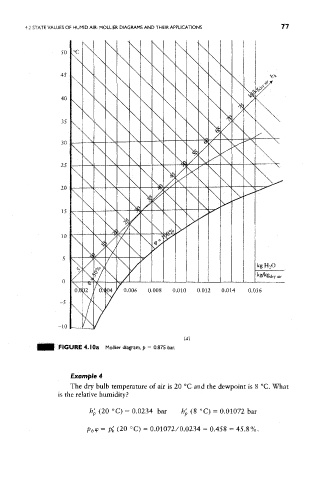
FIGURE 4.1 Oa Mollier diagram, p = 0.875 bar.
Example 4
The dry bulb temperature of air is 20 °C and the dewpoint is 8 °C. What
is the relative humidity?
h' p (20 °C) = 0.0234 bar b' p (8 °C) = 0.01072 bar
p h<p = p' h (20 °C) = 0.01072/0.0234 = 0.458 = 45.8%,