
Page 114 - Industrial Ventilation Design Guidebook
P. 114
4,2 STATE VALUES OF HUMID AIR; MOLLIER DIAGRAMS AND THEIR APPLICATIONS 79
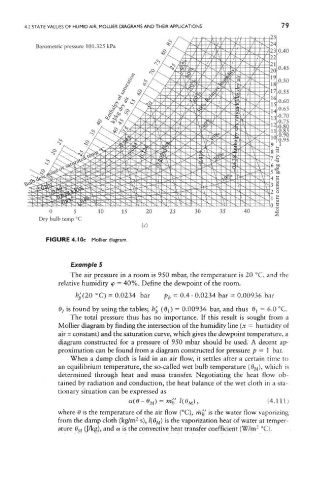
FIGURE 4.1 Oc Mollier diagram.
Example 5
The air pressure in a room is 950 mbar, the temperature is 20 °C, and the
relative humidity <p = 40%. Define the dewpoint of the room.
^(20 °C) = 0.0234 bar p h = 0.4 • 0.0234 bar = 0.00936 bar
a, is found by using the tables; h' p (0j) = 0.00936 bar, and thus Q l = 6.0 °C.
The total pressure thus has no importance. If this result is sought from a
Mollier diagram by finding the intersection of the humidity line (x ~ humidity of
air = constant) and the saturation curve, which gives the dewpoint temperature, a
diagram constructed for a pressure of 950 mbar should be used. A decent ap-
proximation can be found from a diagram constructed for pressure p = 1 bar.
When a damp cloth is laid in an air flow, it settles after a certain time to
an equilibrium temperature, the so-called wet bulb temperature (0 M), which is
determined through heat and mass transfer. Negotiating the heat flow ob-
tained by radiation and conduction, the heat balance of the wet cloth in a sta-
tionary situation can be expressed as
f
where 0 is the temperature of the air flow (°C), m' h is the water flow vaporizing
2
from the damp cloth (kg/m s), /(0 M) is the vaporization heat of water at temper-
2
ature 6 M (J/kg), and a is the convective heat transfer coefficient (W/m °C).