
Page 111 - Industrial Ventilation Design Guidebook
P. 111
76 CHAPTER 4 PHYSICAL FUNDAMENTALS
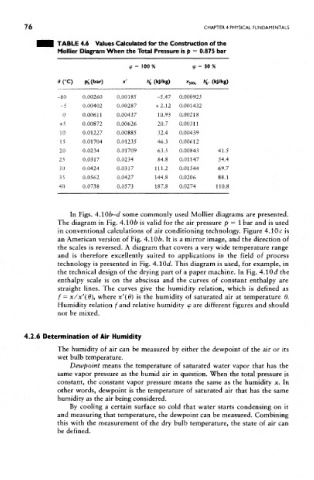
TABLE 4.6 Values Calculated for the Construction of the
Mollier Diagram When the Total Pressure is p = 0.875 bar
<p - 100% 9-50 %
0fC) K(bar) x' h' k (kj/kg) x so% h' k. (kj/kg)
-10 0.00260 0.00185 -5.47 0.000925
-5 0.00402 0.00287 +2.12 0.001432
0 0.00611 0.00437 10.93 0.00218
+5 0.00872 0.00626 20.7 0.00311
10 0.01227 0.00885 32.4 0.00439
15 0.01704 0.01235 46.3 0.00612
20 0.0234 0.01709 63.5 0.00843 41.5
25 0.0317 0.0234 84.8 0.01147 54.4
30 0.0424 0.0317 111.2 0.01544 69.7
35 0.0562 0.0427 144.8 0.0206 88.1
40 0.0738 0.0573 187.8 0.0274 110.8
In Figs. 4AQb-d some commonly used Mollier diagrams are presented.
The diagram in Fig. 4.1 Ob is valid for the air pressure p = 1 bar and is used
in conventional calculations of air conditioning technology. Figure 4.10 c is
an American version of Fig. 4.106. It is a mirror image, and the direction of
the scales is reversed. A diagram that covers a very wide temperature range
and is therefore excellently suited to applications in the field of process
technology is presented in Fig. 4.10d. This diagram is used, for example, in
the technical design of the drying part of a paper machine. In Fig. 4.10^? the
enthalpy scale is on the abscissa and the curves of constant enthalpy are
straight lines. The curves give the humidity relation, which is defined as
f= x/x'(B\ where x'(6) is the humidity of saturated air at temperature 6.
Humidity relation f and relative humidity (p are different figures and should
not be mixed.
4.2.6 Determination of Air Humidity
The humidity of air can be measured by either the dewpoint of the air or its
wet bulb temperature.
Dewpoint means the temperature of saturated water vapor that has the
same vapor pressure as the humid air in question. When the total pressure is
constant, the constant vapor pressure means the same as the humidity x. In
other words, dewpoint is the temperature of saturated air that has the same
humidity as the air being considered.
By cooling a certain surface so cold that water starts condensing on it
and measuring that temperature, the dewpoint can be measured. Combining
this with the measurement of the dry bulb temperature, the state of air can
be defined.