
Page 342 - Instant notes
P. 342
Physical Chemistry 328
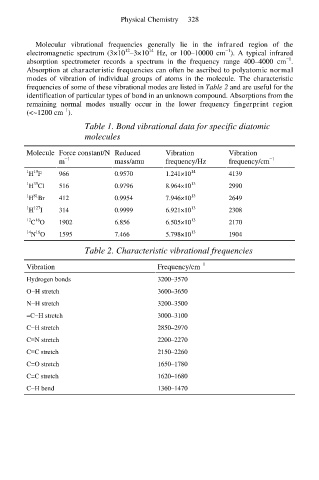
Molecular vibrational frequencies generally lie in the infrared region of the
14
12
−1
electromagnetic spectrum (3×10 –3×10 Hz, or 100–10000 cm ). A typical infrared
−1
absorption spectrometer records a spectrum in the frequency range 400–4000 cm .
Absorption at characteristic frequencies can often be ascribed to polyatomic normal
modes of vibration of individual groups of atoms in the molecule. The characteristic
frequencies of some of these vibrational modes are listed in Table 2 and are useful for the
identification of particular types of bond in an unknown compound. Absorptions from the
remaining normal modes usually occur in the lower frequency fingerprint region
−1
(<~1200 cm ).
Table 1. Bond vibrational data for specific diatomic
molecules
Molecule Force constant/N Reduced Vibration Vibration
−1
−1
m mass/amu frequency/Hz frequency/cm
19
1 H F 966 0.9570 1.241×10 14 4139
35
1 H Cl 516 0.9796 8.964×10 13 2990
81
1 H Br 412 0.9954 7.946×10 13 2649
127
1 H I 314 0.9999 6.921×10 13 2308
16
12 C O 1902 6.856 6.505×10 13 2170
14 N O 1595 7.466 5.798×10 13 1904
16
Table 2. Characteristic vibrational frequencies
−1
Vibration Frequency/cm
Hydrogen bonds 3200–3570
O−H stretch 3600–3650
N−H stretch 3200–3500
=C−H stretch 3000–3100
C−H stretch 2850–2970
C≡N stretch 2200–2270
C≡C stretch 2150–2260
C=O stretch 1650–1780
C=C stretch 1620–1680
C−H bend 1360–1470