
Page 331 - Instrumentation Reference Book 3E
P. 331
Thermal analysis 315
from the property being measured are recorded
on the thermal analysis curve. It is, of course, 200 "
possible to combine both modifications, thereby
recording the derivative of a differential signal. ?
Most measuring units are designed specifically g ._ w e
for a particular thermal analysis technique, but 2 100 @
fkmces, programers, amplifiers, and recorders Ilil
are common to all types of instrument. Instru-
ment manufacturers therefore generally construct 0
a basic control unit containing programming and Time
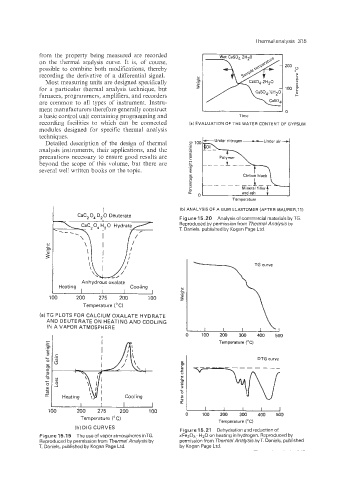
recording facilities to which can be connected (a) EVALUATION OF THE WATER CONTENT OF GYPSUM
modules designed for specific thermal analysis
techniques.
Detailed description of the design of thermal Under nitrogen-Under air-
analysis instruments, their applications, and the E
precautions necessary to ensure good results are E
beyond the scope of this volume, but there are g
.-
several well written books on the topic. z
m cn
2
5
e
a!
0
Temperature
(bl ANALYSIS OF A GUM ELASTOMER (AFTER MAURER.11)
Figure 15.20 Analysisof commercial materials by TG.
Reproduced by permission from Thermal Analysis by
T. Daniels, published by Kogan Page Ltd.
r'
UY .-
!2
100 200 275 200 100
Temperature ("C)
(a)TG PLOTS FOR CALCIUM OXALATE HYDRATE
AND DEUTERATE ON HEATING AND COOLING
IN A VAPOR ATMOSPHERE
I
Temperature ("C)
+2
-s
cn .-
W
3
Y- .- C
O rn
UY
(u
C
m
1
Y-
O
W
m
c
lx
I I I I
1 0 200 275 200 100 0 100 200 300 400 500
Temperature ("C) Temperature ("C)
(b) DIG CURVES Figure15.21 Dehydration and reduction of
Figurel5.19 Theuseof vaporatmospheresinTG. xFePOB. H20 on heating in hydrogen. Reproduced by
Reproduced by permission from Thermal Analysis by permission from Thermal Analysis by T. Daniels, published
T. Daniels, published by Kogan Page Ltd. by Kogan Page Ltd.