
Page 327 - Instrumentation Reference Book 3E
P. 327
Polarography and anodic stripping voltammetry 311
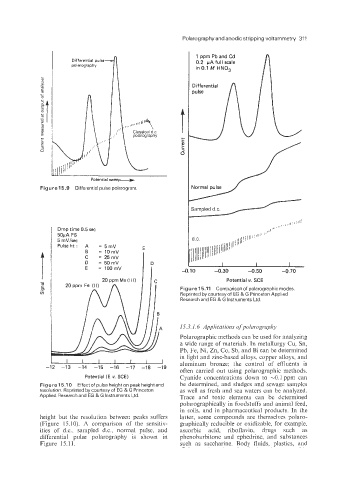
1 ppm Pb and Cd
Differential pulse
polarography 0.2 pA full scale
in 0.1 M HN03
L
N >.
-
m
LT
m
r
+ i
Q
0
3
Y
v
f
2
I
E
Potential sweep-
Figure 15.9 Differential pulse polarogram
Drop time 0.5 sec
50pA FS
5 mV/sec
Pulse ht : A = 5 mV E
8 = 10mV
C = 25mV
D = 50mV D I I 1 I
E = l00mV I -0.10 -0.30 -0.50 -0.70
Potential v. SCE
Figure 15.11 Comparison of polarographic modes.
Reprinted by courtesy of EG & G Princeton Applied
Research and EG & G Instruments Ltd.
15.3.1.6 Applications ofpolarography
Polarographic methods can be used €or analyzing
a wide range of materials. In metallurgy Cu; Sn,
Pb, Fe, Ni, Zn, Co, Sb. and Bi can be determined
I I I I I I I I in light and zinc-based alloys, copper alloys, and
aluminum bronze; the control of effluents is
-12 -13 -14 -15 -16 -17 -18 -19
often carried out using polarographic methods.
Potential (E v. SCE) Cyanide concentrations down to -0.1 pprn can
Figure 15.10 Effectof pulseheighton peak heightand be determined, and sludges and sewage samples
resolution. Reprinted by courtesy of EG & G Princeton as well as fresh and sea waters can be analyzed.
Applied Research and EG & G Instruments Ltd. Trace and toxic elements can be determined
polarographically in foodstuffs and animal feed,
in soils; and in pharmaceutical products. In the
height but the resolution between peaks suffers latter, some compounds are themselves polaro-
(Figure 15.10). A comparison of the sensitiv- graphically reducible or oxidizable, for example,
ities of d.c., sampled d.c.; normal pulse, and ascorbic acid, riboflavin, drugs such as
differential pulse polarography is shown in phenobarbitone and ephedrine, and substances
Figure 15.1 1. such as saccharine. Body fluids, plastics, and