Page 324 - Instrumentation Reference Book 3E
P. 324

308  Chemical analysis: introduction


                 cathode
                                                    c                 Potentiometer
                                                                      circuit


                                                             M icroam meter


                              II,,                                       instruments
                                                                         In commercial
                                    Capillary
              N2              n      Hg drop
              gas
              bubbles                                               Cathode
                                                                              Chart
                                                                              recorder
                                     Sample solution
                 Mercury pool   I
                              I
                 anode                                                       Controlled
                                                                             voltage


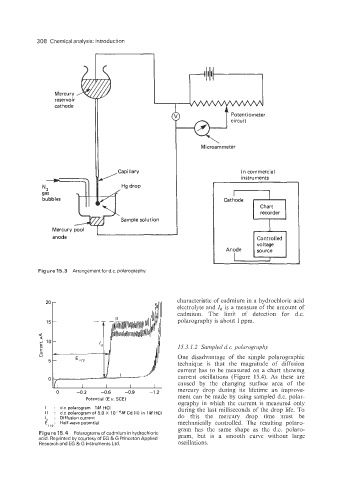
             Figure 15.3  Arrangementf0rd.c. polarography.


                                                      characteristic  of cadmium in a hydrochloric  acid
                                                      electrolyte and Id is a measure  of the amount of
                                                      cadmium.  The  limit  of  detection  for  d.c.
                                                      polarography is about 1 ppm.


                                                      15.3.1.2  Sainpled d.c. polnrogrrrplqv
                                                      One  disadvantage  of  the  simple  polarographic
                                                      technique  is  that  the  magnitude  of  diffusion
                                                      current  has  to be measured  on a chart showing
                                                      current  oscillations  (Figure  15.4). As  these  are
                                                      caused  by  the  changing  surface  area  of  the
                  0     -0.3   -0.6   -0.9   -1.2     mercury  drop  during  its  lifetime  an  improve-
                           Potential (E v. SCE)       ment can be made by  using sampled d.c.  polar-
                                                      ography  in  which  the  current  is measured  only
               I   :  d.c  polarogram  tM HCI         during the last  milliseconds of  the drop life. To
               II   :  d c  polarogram of 5.0 X  lO-'M  Cd (ii) in 1M HCI
              Id   :  Diffusion current               do  this  the  mercury  drop  time  must  be
              E,,2:  Half-wave potential              mechanically  controlled.  The  resulting  polaro-
                                                      gram  has  the  same  shape  as  the  d.c.  polaro-
             Figure 15.4  Polarogramsof cadmium in hydrochloric
             acid. Reprinted by courtesy of EG & G Princeton Applied   gram,  but  is  a  smooth  curve  without  large
             Research and EG & G Instruments Ltd.     oscillations.
   319   320   321   322   323   324   325   326   327   328   329