
Page 506 - Instrumentation Reference Book 3E
P. 506
Frequency and phase measurement using an oscilloscope 489
20.9 Frequency and phase
measurement using
an oscilloscope
where n, is the number of crossings of the hori-
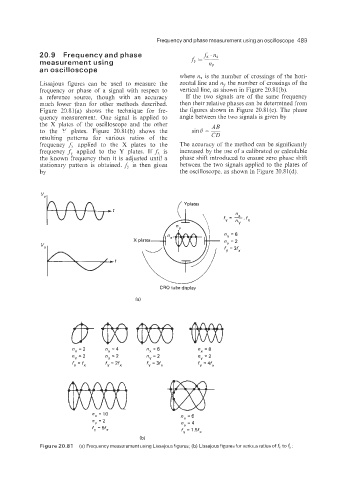
Eissajous figures can be used to measure the zontal line and piY the number of crossings of the
frequency or phase of a signal with respect to vertical line, as shown in Figure 10.81(b).
a reference source, though with an accuracy If the two signals are of the same frequency
much lower than for other methods described. then their relative phases can be determined from
Figure 20.81(a) shows the technique for fre- the figures shown in Figure 20.81(c). The phase
quency measurement. One signal is applied to angle between the two signals is given by
the X plates of the oscilloscope and the other AB
to the Y plates. Figure 20.81(b) shows the sind = -
resulting patterns for various ratios of the CD
frequency fA applied to the X plates to the The accuracy of the method can be significantly
frequency fY applied to the Y plates. If fx is increased by the use of a calibrated or calculable
the known frequency then it is adjusted until a phase shift introduced to ensure zero phase shift
stationary pattern is obtained. f, then given between the two signals applied to the plates of
is
by the oscilloscope, as shown in Figure 20.81(d).
f = “..fx
v n
Y
nx = 6
ny = 2
fy = 3fx
CRO tube display
(a)
nx = 2 nx =4 nx=6 nx =8
n =2 ny = 2 ny = 2 ny = 2
f =fx f = 2fx fy = 3fx fy = 4fx
nx = 10 nx=6
ny = 2 ny = 4
f,=5f, f = 1.5fX
(b)
Figure 20.84 (a) Frequency measurement using Lissajous figures; (b) Lissajous figures for various ratios of fx to fy;