
Page 504 - Instrumentation Reference Book 3E
P. 504
Digital frequency and period/time-interval measurement 487
I I standard deviation on the time estimate is
1 I Ill I I I!I I I
Clock ToScI(2JN). By employing repeated measure-
ments using a IO-MHz clock it is possible tc
Gate obtain a resolution of 10 ps. Repeated measure-
ments also reduce errors due to trigger errors
Counted signal /I 1 I I I caused by noise. The relative accuracy of TIA
I I measurements is given by
I I
TE
Clock I I Ill I I I II] I I &Resolution of T +- J(N) , + = Relative TBE
T
Gate
With a high degree of confidence this can be
I I expressed as
Counted signal I I II
1
Figure 20.78 Resolution of one-shot time-interval +-.-+ 1 TE *- Relative TBE
measurement. JN ii - J(N). ii . To,, ii . To,,
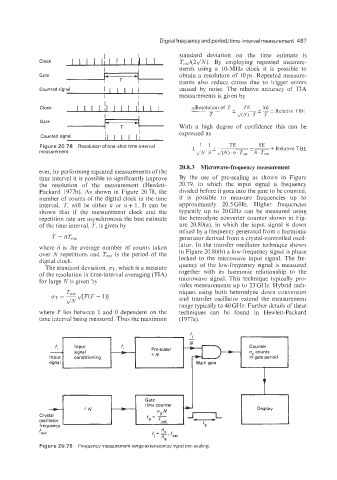
20.8.3 Microwave-frequency measurement
ever, by performing repeated measurements of the
time interval it is possible to significantly improve By the use of pre-scaling as shown in Figure
the resolution of the measurement (Hewlett- 20.79, in which the input signal is frequency
Packard 1977b). As shown in Figure 20.78, the divided before it goes into the gate to be counted,
mmber of counts of the digital clock in the time it is possible to measure frequencies up to
interval, T, will be either iz or n + 1. It can be approximately 20.5 GHz. Higher frequencies
shown that if the measurement clock and the typically up to 20GHz can be measured using
repetition rate are asynchronous the best estimate the heterodyne converter counter shown in Fig-
of the time interval, T, is given by ure 20.80(a), in which the input signal is down
mixed by a frequency generated from a harmonic
T = ETosc generator derived from a crystal-controlled oscil-
lator. In the transfer oscillator technique shown
where fi is the average number of counts taken
over N repetitions and To,, is the period of the in Figure 20.80(b) a low-frequency signal is phase
digital clock. locked to the microwave input signal. The fre-
quency of the low-frequency signal is measured
The standard deviation, UT, which is a measure
of the resolution in time-interval averaging (TIA) together with its harmonic relationship to the
microwave signal. This technique typically pro-
for large N is given by
vides measurements up to 23 GHz. Hybrid tech-
niques using both heterodyne down conversion
and transfer oscillator extend the measurement
range typically to 40 GHz. Further details of these
where F lies between 1 and 0 dependent on the techniques can be found in Hewlett-Packard
time interval being measured. Thus the maximum (1977a).
f.
time counter
”
n
fa,, f. = 2.
I
fa,,
9
Figure 20.79 Frequency measurement range extension by input pre-scaling.