
Page 125 - Materials Chemistry, Second Edition
P. 125
L1644_C03.fm Page 100 Tuesday, October 21, 2003 3:11 PM
Inventory Modeling Weighting of
Inventory Damage to
Results Effect and the Three
Phase Resources
Damage Damage
Categories
Modeling all
the Processes Resources Damage to Indicator
in the Ecosystem
Life-cycle Quality
Land Use
Mainly in
Ecosphere Damage to
and Human Mainly in
Mainly in Emission Valuesphere Health Valuesphere
Technosphere
.
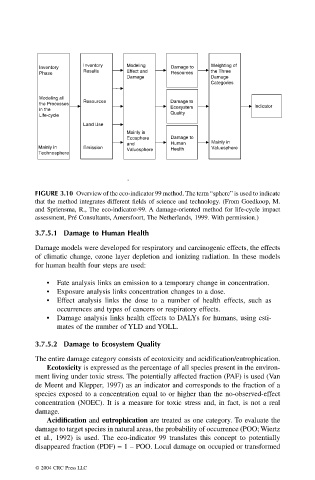
FIGURE 3.10 Overview of the eco-indicator 99 method. The term “sphere” is used to indicate
that the method integrates different fields of science and technology. (From Goedkoop, M.
and Spriensma, R., The eco-indicator-99. A damage-oriented method for life-cycle impact
assessment, Pré Consultants, Amersfoort, The Netherlands, 1999. With permission.)
3.7.5.1 Damage to Human Health
Damage models were developed for respiratory and carcinogenic effects, the effects
of climatic change, ozone layer depletion and ionizing radiation. In these models
for human health four steps are used:
• Fate analysis links an emission to a temporary change in concentration.
• Exposure analysis links concentration changes to a dose.
• Effect analysis links the dose to a number of health effects, such as
occurrences and types of cancers or respiratory effects.
• Damage analysis links health effects to DALYs for humans, using esti-
mates of the number of YLD and YOLL.
3.7.5.2 Damage to Ecosystem Quality
The entire damage category consists of ecotoxicity and acidification/eutrophication.
Ecotoxicity is expressed as the percentage of all species present in the environ-
ment living under toxic stress. The potentially affected fraction (PAF) is used (Van
de Meent and Klepper, 1997) as an indicator and corresponds to the fraction of a
species exposed to a concentration equal to or higher than the no-observed-effect
concentration (NOEC). It is a measure for toxic stress and, in fact, is not a real
damage.
Acidification and eutrophication are treated as one category. To evaluate the
damage to target species in natural areas, the probability of occurrence (POO; Wiertz
et al., 1992) is used. The eco-indicator 99 translates this concept to potentially
disappeared fraction (PDF) = 1 – POO. Local damage on occupied or transformed
© 2004 CRC Press LLC