
Page 128 - Materials Chemistry, Second Edition
P. 128
L1644_C03.fm Page 103 Tuesday, October 21, 2003 3:11 PM
50%
40%
30%
H
80%
70%
60%
Resources
50%
40%
30%
20%
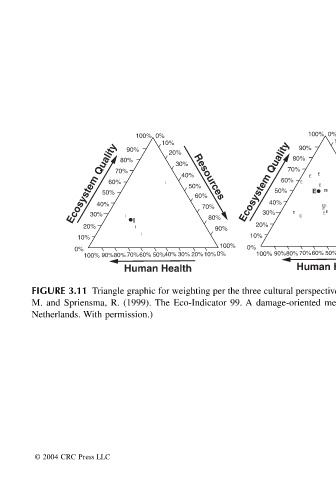
0% 0% 100% 10% 10% 90% 20% Resources 50% 60% 60% H H 40% 70% H H 70% H 30% 80% 80% H Ecosystem Quality 20% 90% 90% 10% 100% 100% 0% 100% 90%80% 70%60% 50%40% 30% 20%10%0% Human Health Human Health Triangle graphic for weighting per the three cultural perspectives: individualist = I; egalitarian = E; hi
E E E E E E E 100% 90%80% 70%60% 50%40% 30% 20%10%0%
100% E E E E M. and Spriensma, R. (1999). The Eco-Indicator 99. A damage-oriented method of life-cycle impact analysis, Pré Consultants, Amersfoort, The
90% 80% E E
70%
60% 50% 40% E 30% Ecosystem Quality 20% 10% 0%
Resources 60% 70% 80% 90% 100%
30% 40% 50%
20%
10% I
0% 100% 90%80% 70%60% 50%40% 30% 20%10%0% Human Health
100% I
90% 80% 70% 60% I I I
50%
40%
30% Ecosystem Quality 20% 10% 0% Netherlands. With permission.)
FIGURE 3.11 © 2004 CRC Press LLC