
Page 126 - Materials Chemistry, Second Edition
P. 126
L1644_C03.fm Page 101 Tuesday, October 21, 2003 3:11 PM
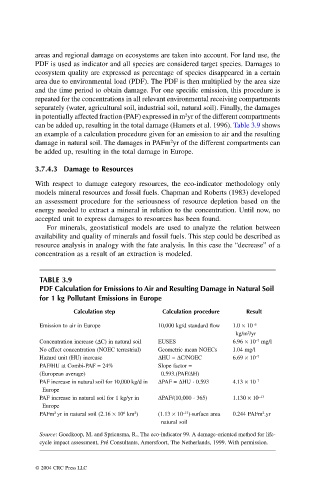
areas and regional damage on ecosystems are taken into account. For land use, the
PDF is used as indicator and all species are considered target species. Damages to
ecosystem quality are expressed as percentage of species disappeared in a certain
area due to environmental load (PDF). The PDF is then multiplied by the area size
and the time period to obtain damage. For one specific emission, this procedure is
repeated for the concentrations in all relevant environmental receiving compartments
separately (water, agricultural soil, industrial soil, natural soil). Finally, the damages
2
in potentially affected fraction (PAF) expressed in m yr of the different compartments
can be added up, resulting in the total damage (Hamers et al. 1996). Table 3.9 shows
an example of a calculation procedure given for an emission to air and the resulting
2
damage in natural soil. The damages in PAFm yr of the different compartments can
be added up, resulting in the total damage in Europe.
3.7.4.3 Damage to Resources
With respect to damage category resources, the eco-indicator methodology only
models mineral resources and fossil fuels. Chapman and Roberts (1983) developed
an assessment procedure for the seriousness of resource depletion based on the
energy needed to extract a mineral in relation to the concentration. Until now, no
accepted unit to express damages to resources has been found.
For minerals, geostatistical models are used to analyze the relation between
availability and quality of minerals and fossil fuels. This step could be described as
resource analysis in analogy with the fate analysis. In this case the “decrease” of a
concentration as a result of an extraction is modeled.
TABLE 3.9
PDF Calculation for Emissions to Air and Resulting Damage in Natural Soil
for 1 kg Pollutant Emissions in Europe
Calculation step Calculation procedure Result
–6
Emission to air in Europe 10,000 kg/d standard flow 1.0 × 10
kg/m /yr
2
Concentration increase (∆C) in natural soil EUSES 6.96 × 10 mg/l
–7
No effect concentration (NOEC terrestrial) Geometric mean NOECs 1.04 mg/l
Hazard unit (HU) increase ∆HU = ∆C/NOEC 6.69 × 10 –7
PAF/HU at Combi-PAF = 24% Slope factor =
(European average) 0.593.(PAF/∆H)
PAF increase in natural soil for 10,000 kg/d in ∆PAF = ∆HU · 0.593 4.13 × 10 –7
Europe
PAF increase in natural soil for 1 kg/yr in ∆PAF/(10,000 · 365) 1.130 × 10 –13
Europe
PAFm yr in natural soil (2.16 × 10 km ) (1.13 × 10 )·surface area 0.244 PAFm .yr
–13
2
2
2
6
natural soil
Source: Goedkoop, M. and Spriensma, R., The eco-indicator 99. A damage-oriented method for life-
cycle impact assessment, Pré Consultants, Amersfoort, The Netherlands, 1999. With permission.
© 2004 CRC Press LLC