
Page 138 - Materials Chemistry, Second Edition
P. 138
L1644_C03.fm Page 112 Tuesday, October 21, 2003 3:11 PM
improvement and two others show a worsening of the environmental performance
of the process chain under study. This observation questions the validity of an
approach based only on a value to measure the environmental performance. However,
above all, this kind of comparison is difficult because the number and types of
environmental loads considered in each method vary significantly.
According to EU environmental policy, the installation of advance gas treatment
systems is obligatory in order to reduce the emission of gases such as SO and HCl
2
as well as particulate matter, PCDD/Fs and heavy metals. The results of the Eco-
Indicator 95 and the Tellus methods are in agreement with this policy, whereas the
MIPS and EPS indicate the contrary. Using MIPS, such a result is found because
more raw materials are necessary for the emission reduction technologies. In the
EPS results obtained, more than 96% of the total is caused by CO . In the same way
2
as explained for the Eco-Indicator 95 results, the contribution of the heavy metals
decreases, while the values for NO and CO increase because they are not eliminated
2
x
and the overall energy efficiency declines.
3.12 QUESTIONS AND EXERCISES
1. Build a cause-effect diagram associating inventory results with impact
categories, category indicators, and category endpoints for each case,
starting from a life-cycle inventory for: CO , SO , CH , N O, NO , and Pb.
2
2
4
2
2
2. Associate possible midpoint and/or endpoint indicators with the following
impact categories: stratospheric ozone depletion; acidification; eco-toxic-
ity; and human toxicity.
3. Explain the main differences between midpoint and endpoint indicators
in LCIA. Try to explain these differences by using some examples.
4. Summarize the main advantages and disadvantages of using endpoint
approaches in LCA.
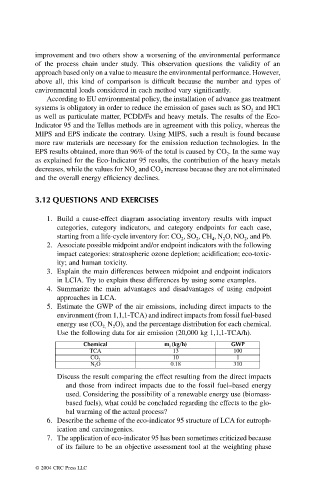
5. Estimate the GWP of the air emissions, including direct impacts to the
environment (from 1,1,1-TCA) and indirect impacts from fossil fuel-based
energy use (CO N O), and the percentage distribution for each chemical.
2
2,
Use the following data for air emission (20,000 kg 1,1,1-TCA/h).
Chemical m i (kg/h) GWP
TCA 13 100
10 1
CO 2
N 2 O 0.18 310
Discuss the result comparing the effect resulting from the direct impacts
and those from indirect impacts due to the fossil fuel–based energy
used. Considering the possibility of a renewable energy use (biomass-
based fuels), what could be concluded regarding the effects to the glo-
bal warming of the actual process?
6. Describe the scheme of the eco-indicator 95 structure of LCA for eutroph-
ication and carcinogenics.
7. The application of eco-indicator 95 has been sometimes criticized because
of its failure to be an objective assessment tool at the weighting phase
© 2004 CRC Press LLC