Page 136 - Materials Chemistry, Second Edition
P. 136

L1644_C03.fm  Page 110  Tuesday, October 21, 2003  3:11 PM


                                 the corresponding mass of bottling material (kg) and transport intensity
                                 (tkm) by the EL per unit of material and transport previously given as data:


                                             PET bottle                 Glass bottle
                               EL     PET               Total   Glass                  Total
                                             Transport                   Transport
                                          –1
                             CO 2  (kg) 2.09 × 10 5.11 × 10 –2  2.60 ×× ×× 10 –1  4.59 × 10 –2  1.41 × 10 –1  1.87 ×× ×× 10 –1
                                          –4
                             CH 4  (kg) 7.09 × 10 8.37 × 10 –5  7.93 ×× ×× 10 –4  1.10 × 10 –4  2.31 × 10 –4  3.41 ×× ×× 10 –4
                                The contribution in percentage is presented as follows:
                                                PET bottle                   Glass bottle
                                EL     PET                   Total  Glass                 Total
                                                Transport                     Transport
                             CO 2  (kg)  80.4     19.6      100.0    47.6       52.4      100.0
                             CH 4  (kg)  89.4     10.6      100.0    57.1       42.9      100.0

                                The amount of equivalent CO is calculated by multiplying the mass of
                                                         2
                                 methane (CH ) by the corresponding factor and adding it to the mass of CO .
                                            4
                                                                                            2
                                         CO 2  Equivalent          PET            Glass
                                                                  0.260           0.187
                                             CO 2
                                                                  0.049           0.021
                                             CH 4
                                         CO 2  TOTAL kg           0.309           0.208
                                Conclusion: Regarding the greenhouse effect, it is preferable to consume min-
                             eral water in glass bottles, in consideration of the assumptions made and the data
                             provided.

                             3.11 CASE STUDY: APPLICATION OF LCIA METHODS
                                 IN THE MSWI PROCESS CHAIN LCA

                             The results of the application of the Eco-Indicator 95 method to the MSWI process
                             chain LCA (see Chapter 2) are shown in Table 3.12. Scenario 2, the current operation
                             of the incineration plant after the installation of an advanced gas treatment system,
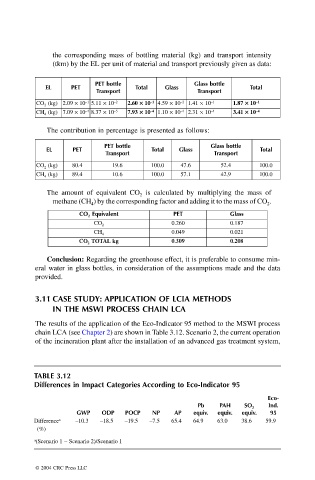


                            TABLE 3.12
                            Differences in Impact Categories According to Eco-Indicator 95

                                                                                            Eco-
                                                                         Pb    PAH    SO 2    Ind.
                                        GWP    ODP   POCP    NP    AP   equiv.  equiv.  equiv.  95
                            Difference   a  –10.3  –18.5  –19.5  –7.5  65.4  64.9  63.0  38.6  59.9
                             (%)
                            a (Scenario 1 – Scenario 2)/Scenario 1


                             © 2004 CRC Press LLC
   131   132   133   134   135   136   137   138   139   140   141