
Page 209 - Materials Chemistry, Second Edition
P. 209
L1644_C05.fm Page 182 Monday, October 20, 2003 12:02 PM
managed. Among the wide range of statistical distributions (normal, log-normal,
uniform, etc.) found in MC simulation, we will refer only to the most common types
of probability distributions, which are:
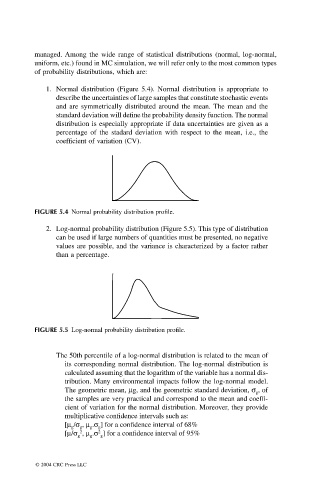
1. Normal distribution (Figure 5.4). Normal distribution is appropriate to
describe the uncertainties of large samples that constitute stochastic events
and are symmetrically distributed around the mean. The mean and the
standard deviation will define the probability density function. The normal
distribution is especially appropriate if data uncertainties are given as a
percentage of the stadard deviation with respect to the mean, i.e., the
coefficient of variation (CV).
FIGURE 5.4 Normal probability distribution profile.
2. Log-normal probability distribution (Figure 5.5). This type of distribution
can be used if large numbers of quantities must be presented, no negative
values are possible, and the variance is characterized by a factor rather
than a percentage.
FIGURE 5.5 Log-normal probability distribution profile.
The 50th percentile of a log-normal distribution is related to the mean of
its corresponding normal distribution. The log-normal distribution is
calculated assuming that the logarithm of the variable has a normal dis-
tribution. Many environmental impacts follow the log-normal model.
The geometric mean, mg, and the geometric standard deviation, s , of
g
the samples are very practical and correspond to the mean and coeffi-
cient of variation for the normal distribution. Moreover, they provide
multiplicative confidence intervals such as:
[m /s , m .s ] for a confidence interval of 68%
g
g
g
g
2
[m/s , m .s ] for a confidence interval of 95%
2
g
g
g
© 2004 CRC Press LLC