Page 214 - Materials Chemistry, Second Edition
P. 214

L1644_C05.fm  Page 187  Monday, October 20, 2003  12:02 PM


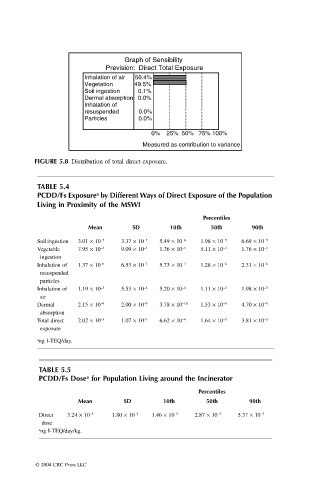
                                                             Graph of Sensibility
                                                        Prevision:  Direct Total Exposure
                                                  Inhalation of air      50.4%
                                                  Vegetation             49.5%
                                                  Soil ingestion           0.1%
                                                  Dermal absorption   0.0%
                                                  Inhalation of
                                                  resuspended            0.0%
                                                  Particles                  0.0%

                                                                    0%    25%  50%   75% 100%
                                                                  Measured as contribution to variance

                                    FIGURE 5.8 Distribution of total direct exposure.


                                     TABLE 5.4
                                                     a
                                     PCDD/Fs Exposure  by Different Ways of Direct Exposure of the Population
                                     Living in Proximity of the MSWI
                                                                                   Percentiles
                                                   Mean        SD        10th        50th       90th

                                     Soil ingestion   3.01 ¥ 10 –5  3.37 ¥ 10 –5  5.49 ¥ 10 –6  1.98 ¥ 10 –5  6.69 ¥ 10 –5
                                     Vegetable   7.95 ¥ 10 –4  9.09 ¥ 10 –4  1.36 ¥ 10 –4  5.11 ¥ 10 –4  1.76 ¥ 10 –3
                                     ingestion
                                     Inhalation of   1.37 ¥ 10 –6  6.53 ¥ 10 –7  5.73 ¥ 10 –7  1.28 ¥ 10 –6  2.31 ¥ 10 –6
                                     resuspended
                                     particles
                                     Inhalation of   1.19 ¥ 10 –3  5.53 ¥ 10 –4  5.20 ¥ 10 –4  1.11 ¥ 10 –3  1.98 ¥ 10 –3
                                     air
                                     Dermal     2.15 ¥ 10 –9  2.00 ¥ 10 –9  3.78 ¥ 10 –10  1.53 ¥ 10 –9  4.70 ¥ 10 –9
                                     absorption
                                     Total direct   2.02 ¥ 10 –3  1.07 ¥ 10 –3  6.62 ¥ 10 –4  1.64 ¥ 10 –3  3.81 ¥ 10 –3
                                     exposure
                                     a ng I-TEQ/day.


                                     TABLE 5.5
                                                  a
                                     PCDD/Fs Dose  for Population Living around the Incinerator
                                                                                 Percentiles
                                                Mean         SD         10th       50th        90th
                                     Direct   3.24 ¥ 10 –5  1.80 ¥ 10 –5  1.46 ¥ 10 –5  2.87 ¥ 10 –5  5.37 ¥ 10 –5
                                      dose
                                     a ng I-TEQ/day/kg.


                                    © 2004 CRC Press LLC
   209   210   211   212   213   214   215   216   217   218   219