Page 218 - Materials Chemistry, Second Edition
P. 218

L1644_C05.fm  Page 191  Monday, October 20, 2003  12:02 PM
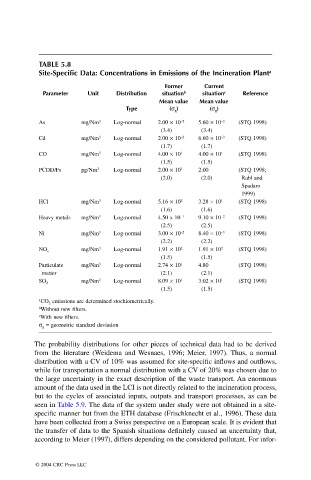


                                     TABLE 5.8
                                     Site-Specific Data: Concentrations in Emissions of the Incineration Plant a

                                                                        Former     Current
                                      Parameter    Unit    Distribution  situation b  situation c  Reference
                                                                      Mean value   Mean value
                                                             Type        (s g )     (s g )
                                                                            –2
                                                                                        –3
                                     As          mg/Nm 3  Log-normal  2.00 ¥ 10    5.60 ¥ 10    (STQ 1998)
                                                                       (3.4)      (3.4)
                                                                                        –3
                                                                            –2
                                     Cd          mg/Nm 3  Log-normal  2.00 ¥ 10    6.60 ¥ 10    (STQ 1998)
                                                                       (1.7)      (1.7)
                                     CO          mg/Nm 3  Log-normal  4.00 ¥ 10   1  4.00 ¥ 10   1  (STQ 1998)
                                                                       (1.5)      (1.5)
                                     PCDD/Fs     pg/Nm 3  Log-normal  2.00 ¥ 10   1  2.00   (STQ 1998;
                                                                       (2.0)      (2.0)      Rabl and
                                                                                             Spadaro
                                                                                             1999)
                                     HCl         mg/Nm 3  Log-normal  5.16 ¥ 10   2  3.28 ¥ 10   1  (STQ 1998)
                                                                       (1.6)      (1.6)
                                                                            –1
                                                                                        –2
                                     Heavy metals   mg/Nm 3  Log-normal  4.50 x 10    9.10 ¥ 10    (STQ 1998)
                                                                       (2.5)      (2.5)
                                                                                        –3
                                                                            –2
                                     Ni          mg/Nm 3  Log-normal  3.00 ¥ 10    8.40 ¥ 10    (STQ 1998)
                                                                       (2.2)      (2.2)
                                                 mg/Nm 3  Log-normal  1.91 ¥ 10   2  1.91 ¥ 10   2  (STQ 1998)
                                     NO x
                                                                       (1.5)      (1.5)
                                     Particulate   mg/Nm 3  Log-normal  2.74 ¥ 10   1  4.80   (STQ 1998)
                                      matter                           (2.1)      (2.1)
                                                 mg/Nm 3  Log-normal  8.09 ¥ 10   1  3.02 ¥ 10   1  (STQ 1998)
                                     SO 2
                                                                       (1.5)      (1.5)
                                     a CO 2  emissions are determined stochiometrically.
                                     b Without new filters.
                                     c With new filters.
                                     s g  = geometric standard deviation

                                    The probability distributions for other pieces of technical data had to be derived
                                    from the literature (Weidema and Wesnaes, 1996; Meier, 1997).  Thus, a normal
                                    distribution with a CV of 10% was assumed for site-specific inflows and outflows,
                                    while for transportation a normal distribution with a CV of 20% was chosen due to
                                    the large uncertainty in the exact description of the waste transport. An enormous
                                    amount of the data used in the LCI is not directly related to the incineration process,
                                    but to the cycles of associated inputs, outputs and transport processes, as can be
                                    seen in Table 5.9. The data of the system under study were not obtained in a site-
                                    specific manner but from the ETH database (Frischknecht et al., 1996). These data
                                    have been collected from a Swiss perspective on a European scale. It is evident that
                                    the transfer of data to the Spanish situations definitely caused an uncertainty that,
                                    according to Meier (1997), differs depending on the considered pollutant. For infor-


                                    © 2004 CRC Press LLC
   213   214   215   216   217   218   219   220   221   222   223