
Page 221 - Materials Chemistry, Second Edition
P. 221
L1644_C05.fm Page 194 Monday, October 20, 2003 12:02 PM
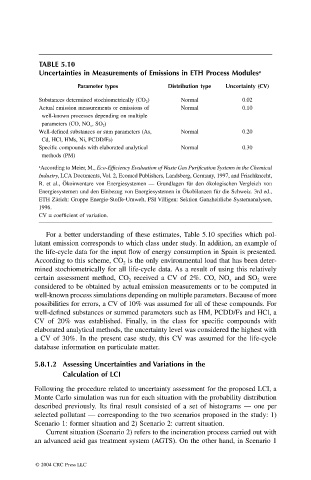
TABLE 5.10
Uncertainties in Measurements of Emissions in ETH Process Modules a
Parameter types Distribution type Uncertainty (CV)
Substances determined stochiometrically (CO 2 ) Normal 0.02
Actual emission measurements or emissions of Normal 0.10
well-known processes depending on multiple
parameters (CO, NO x , SO 2 )
Well-defined substances or sum parameters (As, Normal 0.20
Cd, HCl, HMs, Ni, PCDD/Fs)
Specific compounds with elaborated analytical Normal 0.30
methods (PM)
a According to Meier, M., Eco-Efficiency Evaluation of Waste Gas Purification Systems in the Chemical
Industry, LCA Documents, Vol. 2, Ecomed Publishers, Landsberg, Germany, 1997, and Frischknecht,
R. et al., Ökoinventare von Energiesystemen — Grundlagen für den ökologischen Vergleich von
Energiesystemen und den Einbezug von Energiesystemen in Ökobilanzen für die Schweiz. 3rd ed.,
ETH Zürich: Gruppe Energie-Stoffe-Umwelt, PSI Villigen: Sektion Ganzheitliche Systemanalysen,
1996.
CV = coefficient of variation.
For a better understanding of these estimates, Table 5.10 specifies which pol-
lutant emission corresponds to which class under study. In addition, an example of
the life-cycle data for the input flow of energy consumption in Spain is presented.
According to this scheme, CO is the only environmental load that has been deter-
2
mined stochiometrically for all life-cycle data. As a result of using this relatively
certain assessment method, CO received a CV of 2%. CO, NO and SO were
2
2
x
considered to be obtained by actual emission measurements or to be computed in
well-known process simulations depending on multiple parameters. Because of more
possibilities for errors, a CV of 10% was assumed for all of these compounds. For
well-defined substances or summed parameters such as HM, PCDD/Fs and HCl, a
CV of 20% was established. Finally, in the class for specific compounds with
elaborated analytical methods, the uncertainty level was considered the highest with
a CV of 30%. In the present case study, this CV was assumed for the life-cycle
database information on particulate matter.
5.8.1.2 Assessing Uncertainties and Variations in the
Calculation of LCI
Following the procedure related to uncertainty assessment for the proposed LCI, a
Monte Carlo simulation was run for each situation with the probability distribution
described previously. Its final result consisted of a set of histograms — one per
selected pollutant — corresponding to the two scenarios proposed in the study: 1)
Scenario 1: former situation and 2) Scenario 2: current situation.
Current situation (Scenario 2) refers to the incineration process carried out with
an advanced acid gas treatment system (AGTS). On the other hand, in Scenario 1
© 2004 CRC Press LLC