
Page 224 - Materials Chemistry, Second Edition
P. 224
L1644_C05.fm Page 197 Monday, October 20, 2003 12:02 PM
CO 2
CO
Particles
NOx
Former Situation
Heavy Metals Current Sitation
SO 2
HCl
PCDD/Fs*
1.0E+00 1.0E+02 1.0E+04 1.0E+06 1.0E+08
kg/TJ *for PCDD/Fs in ng/TJ
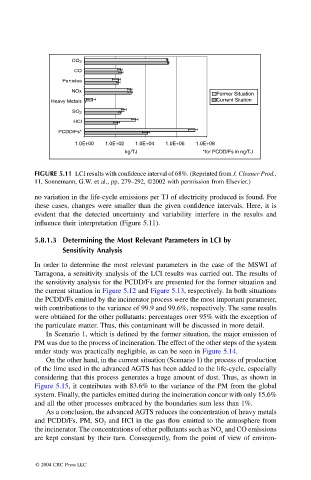
FIGURE 5.11 LCI results with confidence interval of 68%. (Reprinted from J. Cleaner Prod.,
11, Sonnemann, G.W. et al., pp. 279–292, ©2002 with permission from Elsevier.)
no variation in the life-cycle emissions per TJ of electricity produced is found. For
these cases, changes were smaller than the given confidence intervals. Here, it is
evident that the detected uncertainty and variability interfere in the results and
influence their interpretation (Figure 5.11).
5.8.1.3 Determining the Most Relevant Parameters in LCI by
Sensitivity Analysis
In order to determine the most relevant parameters in the case of the MSWI of
Tarragona, a sensitivity analysis of the LCI results was carried out. The results of
the sensitivity analysis for the PCDD/Fs are presented for the former situation and
the current situation in Figure 5.12 and Figure 5.13, respectively. In both situations
the PCDD/Fs emitted by the incinerator process were the most important parameter,
with contributions to the variance of 99.9 and 99.6%, respectively. The same results
were obtained for the other pollutants: percentages over 95% with the exception of
the particulate matter. Thus, this contaminant will be discussed in more detail.
In Scenario 1, which is defined by the former situation, the major emission of
PM was due to the process of incineration. The effect of the other steps of the system
under study was practically negligible, as can be seen in Figure 5.14.
On the other hand, in the current situation (Scenario 1) the process of production
of the lime used in the advanced AGTS has been added to the life-cycle, especially
considering that this process generates a huge amount of dust. Thus, as shown in
Figure 5.15, it contributes with 83.6% to the variance of the PM from the global
system. Finally, the particles emitted during the incineration concur with only 15.6%
and all the other processes embraced by the boundaries sum less than 1%.
As a conclusion, the advanced AGTS reduces the concentration of heavy metals
and PCDD/Fs, PM, SO and HCl in the gas flow emitted to the atmosphere from
2
the incinerator. The concentrations of other pollutants such as NO and CO emissions
x
are kept constant by their turn. Consequently, from the point of view of environ-
© 2004 CRC Press LLC