
Page 225 - Materials Chemistry, Second Edition
P. 225
L1644_C05.fm Page 198 Monday, October 20, 2003 12:02 PM
Graphe de
Prevision: PCDD/F emissions for former situation
sensibilit
Pr vision cible :
TCDD Incineration 99.6%
Incineration 99.9 %
TCDD Ash 0.2%
Ash treatment 0.0 %
0.1%
TCDD Trans 0.0 %
Transport
TCDD Scrap 0.0%
Scrap Metal Recycling 0.0 %
TCDD H2Or 0.0%
Water Treatment 0.0 %
TCDD H2Od 0.0%
Diesel Production 0.0 %
TCDD CaO 0.0%
Lubricant Oil 0.0 %
TCDD Dies 0.0 %
Production
0.0%
Electricity Production
TCDD Lubr 0.0 %
0.0%
TCDD Elec 0.0%
TCDD H2Op 0.0%
0% 25% 50% 75% 100%
Measured as contribution to variance
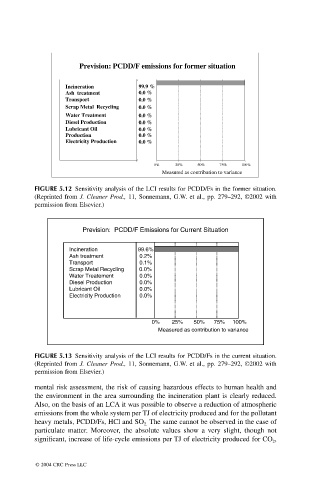
FIGURE 5.12 Sensitivity analysis of the LCI results for PCDD/Fs in the former situation.
(Reprinted from J. Cleaner Prod., 11, Sonnemann, G.W. et al., pp. 279–292, ©2002 with
permission from Elsevier.)
Prevision: PCDD/F Emissions for Current Situation
Incineration 99.6%
Ash treatment 0.2%
Transport 0.1%
Scrap Metal Recycling 0.0%
Water Treatement 0.0%
Diesel Production 0.0%
Lubricant Oil 0.0%
Electricity Production 0.0%
0% 25% 50% 75% 100%
Measured as contribution to variance
FIGURE 5.13 Sensitivity analysis of the LCI results for PCDD/Fs in the current situation.
(Reprinted from J. Cleaner Prod., 11, Sonnemann, G.W. et al., pp. 279–292, ©2002 with
permission from Elsevier.)
mental risk assessment, the risk of causing hazardous effects to human health and
the environment in the area surrounding the incineration plant is clearly reduced.
Also, on the basis of an LCA it was possible to observe a reduction of atmospheric
emissions from the whole system per TJ of electricity produced and for the pollutant
heavy metals, PCDD/Fs, HCl and SO The same cannot be observed in the case of
2.
particulate matter. Moreover, the absolute values show a very slight, though not
significant, increase of life-cycle emissions per TJ of electricity produced for CO ,
2
© 2004 CRC Press LLC