
Page 228 - Materials Chemistry, Second Edition
P. 228
L1644_C05.fm Page 201 Monday, October 20, 2003 12:02 PM
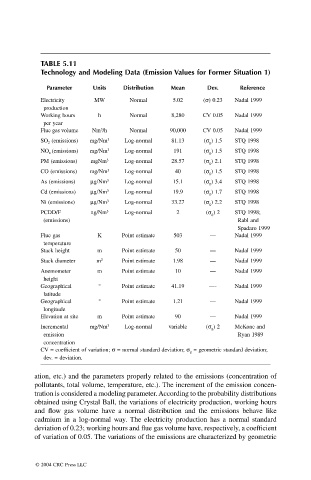
TABLE 5.11
Technology and Modeling Data (Emission Values for Former Situation 1)
Parameter Units Distribution Mean Dev. Reference
Electricity MW Normal 5.02 (s) 0.23 Nadal 1999
production
Working hours h Normal 8,280 CV 0.05 Nadal 1999
per year
3
Flue gas volume Nm /h Normal 90,000 CV 0.05 Nadal 1999
SO 2 (emissions) mg/Nm 3 Log-normal 81.13 (s g ) 1.5 STQ 1998
NO x (emissions) mg/Nm 3 Log-normal 191 (s g ) 1.5 STQ 1998
PM (emissions) mgNm 3 Log-normal 28.57 (s g ) 2.1 STQ 1998
CO (emissions) mg/Nm 3 Log-normal 40 (s g ) 1.5 STQ 1998
As (emissions) mg/Nm 3 Log-normal 15.1 (s g ) 3.4 STQ 1998
Cd (emissions) mg/Nm 3 Log-normal 19.9 (s g ) 1.7 STQ 1998
Ni (emissions) mg/Nm 3 Log-normal 33.27 (s g ) 2.2 STQ 1998
PCDD/F ng/Nm 3 Log-normal 2 (s g ) 2 STQ 1998;
(emissions) Rabl and
Spadaro 1999
Flue gas K Point estimate 503 — Nadal 1999
temperature
Stack height m Point estimate 50 — Nadal 1999
Stack diameter m 2 Point estimate 1.98 — Nadal 1999
Anemometer m Point estimate 10 — Nadal 1999
height
Geographical ∞ Point estimate 41.19 —- Nadal 1999
latitude
Geographical ∞ Point estimate 1.21 — Nadal 1999
longitude
Elevation at site m Point estimate 90 — Nadal 1999
Incremental mg/Nm 3 Log-normal variable (s g ) 2 McKone and
emission Ryan 1989
concentration
CV = coefficient of variation; s = normal standard deviation; s g = geometric standard deviation;
dev. = deviation.
ation, etc.) and the parameters properly related to the emissions (concentration of
pollutants, total volume, temperature, etc.). The increment of the emission concen-
tration is considered a modeling parameter. According to the probability distributions
obtained using Crystal Ball, the variations of electricity production, working hours
and flow gas volume have a normal distribution and the emissions behave like
cadmium in a log-normal way. The electricity production has a normal standard
deviation of 0.23; working hours and flue gas volume have, respectively, a coefficient
of variation of 0.05. The variations of the emissions are characterized by geometric
© 2004 CRC Press LLC