
Page 233 - Materials Chemistry, Second Edition
P. 233
L1644_C05.fm Page 206 Monday, October 20, 2003 12:02 PM
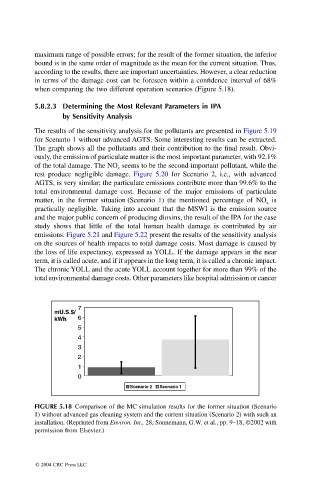
maximum range of possible errors; for the result of the former situation, the inferior
bound is in the same order of magnitude as the mean for the current situation. Thus,
according to the results, there are important uncertainties. However, a clear reduction
in terms of the damage cost can be foreseen within a confidence interval of 68%
when comparing the two different operation scenarios (Figure 5.18).
5.8.2.3 Determining the Most Relevant Parameters in IPA
by Sensitivity Analysis
The results of the sensitivity analysis for the pollutants are presented in Figure 5.19
for Scenario 1 without advanced AGTS. Some interesting results can be extracted.
The graph shows all the pollutants and their contribution to the final result. Obvi-
ously, the emission of particulate matter is the most important parameter, with 92.1%
of the total damage. The NO seems to be the second important pollutant, while the
x
rest produce negligible damage. Figure 5.20 for Scenario 2, i.e., with advanced
AGTS, is very similar; the particulate emissions contribute more than 99.6% to the
total environmental damage cost. Because of the major emissions of particulate
matter, in the former situation (Scenario 1) the mentioned percentage of NO is
x
practically negligible. Taking into account that the MSWI is the emission source
and the major public concern of producing dioxins, the result of the IPA for the case
study shows that little of the total human health damage is contributed by air
emissions. Figure 5.21 and Figure 5.22 present the results of the sensitivity analysis
on the sources of health impacts to total damage costs. Most damage is caused by
the loss of life expectancy, expressed as YOLL. If the damage appears in the near
term, it is called acute, and if it appears in the long term, it is called a chronic impact.
The chronic YOLL and the acute YOLL account together for more than 99% of the
total environmental damage costs. Other parameters like hospital admission or cancer
7
mU.S.$/
kWh 6
5
4
3
2
1
0
Scenario 2 Scenario 1
FIGURE 5.18 Comparison of the MC simulation results for the former situation (Scenario
1) without advanced gas cleaning system and the current situation (Scenario 2) with such an
installation. (Reprinted from Environ. Int., 28, Sonnemann, G.W. et al., pp. 9–18, ©2002 with
permission from Elsevier.)
© 2004 CRC Press LLC