
Page 234 - Materials Chemistry, Second Edition
P. 234
L1644_C05.fm Page 207 Monday, October 20, 2003 12:02 PM
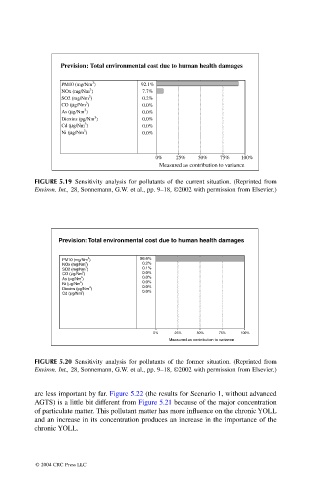
Prevision: Total environmental cost due to human health damages
3
PM10 (mg/Nm ) 92.1%
NOx (mg/Nm ) 3 7.7%
3
SO2 (mg/Nm ) 0.2%
3
CO (mg/Nm ) 0.0%
3
As (mg/Nm ) 0.0%
3
Dioxins (pg/Nm ) 0.0%
3
Cd (mg/Nm ) 0.0%
Ni (mg/Nm ) 3 0.0%
0% 25% 50% 75% 100%
Measured as contribution to variance
FIGURE 5.19 Sensitivity analysis for pollutants of the current situation. (Reprinted from
Environ. Int., 28, Sonnemann, G.W. et al., pp. 9–18, ©2002 with permission from Elsevier.)
Prevision: Total environmental cost due to human health damages
3 99.6%
PM10 (mg/Nm )
NOx (mg/Nm ) 3 0.2%
3 0.1%
SO2 (mg/Nm )
CO (mg/Nm ) 3 0.0%
As (mg/Nm ) 3 0.0%
Ni ( mg/Nm ) 3 0.0%
Dioxins (pg/Nm ) 3 0.0%
Cd (mg/Nm ) 3 0.0%
0% 25% 50% 75% 100%
Measured as contribution to variance
FIGURE 5.20 Sensitivity analysis for pollutants of the former situation. (Reprinted from
Environ. Int., 28, Sonnemann, G.W. et al., pp. 9–18, ©2002 with permission from Elsevier.)
are less important by far. Figure 5.22 (the results for Scenario 1, without advanced
AGTS) is a little bit different from Figure 5.21 because of the major concentration
of particulate matter. This pollutant matter has more influence on the chronic YOLL
and an increase in its concentration produces an increase in the importance of the
chronic YOLL.
© 2004 CRC Press LLC