
Page 230 - Materials Chemistry, Second Edition
P. 230
L1644_C05.fm Page 203 Monday, October 20, 2003 12:02 PM
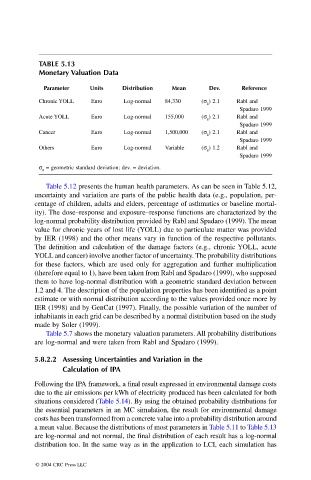
TABLE 5.13
Monetary Valuation Data
Parameter Units Distribution Mean Dev. Reference
Chronic YOLL Euro Log-normal 84,330 (s g ) 2.1 Rabl and
Spadaro 1999
Acute YOLL Euro Log-normal 155,000 (s g ) 2.1 Rabl and
Spadaro 1999
Cancer Euro Log-normal 1,500,000 (s g ) 2.1 Rabl and
Spadaro 1999
Others Euro Log-normal Variable (s g ) 1.2 Rabl and
Spadaro 1999
s g = geometric standard deviation; dev. = deviation.
Table 5.12 presents the human health parameters. As can be seen in Table 5.12,
uncertainty and variation are parts of the public health data (e.g., population, per-
centage of children, adults and elders, percentage of asthmatics or baseline mortal-
ity). The dose–response and exposure–response functions are characterized by the
log-normal probability distribution provided by Rabl and Spadaro (1999). The mean
value for chronic years of lost life (YOLL) due to particulate matter was provided
by IER (1998) and the other means vary in function of the respective pollutants.
The definition and calculation of the damage factors (e.g., chronic YOLL, acute
YOLL and cancer) involve another factor of uncertainty. The probability distributions
for these factors, which are used only for aggregation and further multiplication
(therefore equal to 1), have been taken from Rabl and Spadaro (1999), who supposed
them to have log-normal distribution with a geometric standard deviation between
1.2 and 4. The description of the population properties has been identified as a point
estimate or with normal distribution according to the values provided once more by
IER (1998) and by GenCat (1997). Finally, the possible variation of the number of
inhabitants in each grid can be described by a normal distribution based on the study
made by Soler (1999).
Table 5.7 shows the monetary valuation parameters. All probability distributions
are log-normal and were taken from Rabl and Spadaro (1999).
5.8.2.2 Assessing Uncertainties and Variation in the
Calculation of IPA
Following the IPA framework, a final result expressed in environmental damage costs
due to the air emissions per kWh of electricity produced has been calculated for both
situations considered (Table 5.14). By using the obtained probability distributions for
the essential parameters in an MC simulation, the result for environmental damage
costs has been transformed from a concrete value into a probability distribution around
a mean value. Because the distributions of most parameters in Table 5.11 to Table 5.13
are log-normal and not normal, the final distribution of each result has a log-normal
distribution too. In the same way as in the application to LCI, each simulation has
© 2004 CRC Press LLC