Page 229 - Materials Chemistry, Second Edition
P. 229

L1644_C05.fm  Page 202  Monday, October 20, 2003  12:02 PM
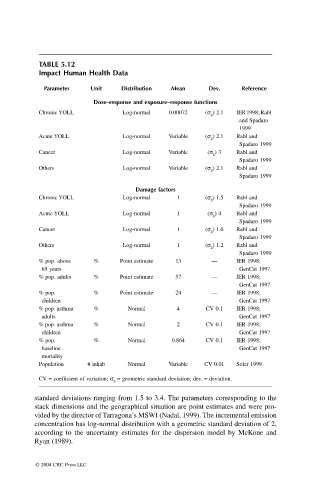


                                     TABLE 5.12
                                     Impact Human Health Data

                                      Parameter    Unit     Distribution  Mean      Dev.     Reference

                                                    Dose–response and exposure–response functions
                                     Chronic YOLL           Log-normal   0.00072   (s g ) 2.1  IER 1998; Rabl
                                                                                             and Spadaro
                                                                                             1999
                                     Acute YOLL             Log-normal   Variable  (s g ) 2.1  Rabl and
                                                                                             Spadaro 1999
                                     Cancer                 Log-normal   Variable   (s g ) 3  Rabl and
                                                                                             Spadaro 1999
                                     Others                 Log-normal   Variable  (s g ) 2.1  Rabl and
                                                                                             Spadaro 1999

                                                                Damage factors
                                     Chronic YOLL           Log-normal     1       (s g ) 1.5  Rabl and
                                                                                             Spadaro 1999
                                     Acute YOLL             Log-normal     1        (s g ) 4  Rabl and
                                                                                             Spadaro 1999
                                     Cancer                 Log-normal     1       (s g ) 1.6  Rabl and
                                                                                             Spadaro 1999
                                     Others                 Log-normal     1       (s g ) 1.2  Rabl and
                                                                                             Spadaro 1999
                                     % pop. above   %       Point estimate  13       —      IER 1998;
                                      65 years                                               GenCat 1997
                                     % pop. adults  %       Point estimate  57       —      IER 1998;
                                                                                             GenCat 1997
                                     % pop.         %       Point estimate  24       —      IER 1998;
                                      children                                               GenCat 1997
                                     % pop. asthma   %        Normal       4       CV 0.1   IER 1998;
                                      adults                                                 GenCat 1997
                                     % pop. asthma   %        Normal       2       CV 0.1   IER 1998;
                                      children                                               GenCat 1997
                                     % pop.         %         Normal      0.864    CV 0.1   IER 1998;
                                      baseline                                               GenCat 1997
                                      mortality
                                     Population    # inhab    Normal     Variable  CV 0.01  Soler 1999

                                     CV = coefficient of variation; s g  = geometric standard deviation; dev. = deviation.

                                    standard deviations ranging from 1.5 to 3.4. The parameters corresponding to the
                                    stack dimensions and the geographical situation are point estimates and were pro-
                                    vided by the director of Tarragona’s MSWI (Nadal, 1999). The incremental emission
                                    concentration has log-normal distribution with a geometric standard deviation of 2,
                                    according to the uncertainty estimates for the dispersion model by McKone and
                                    Ryan (1989).


                                    © 2004 CRC Press LLC
   224   225   226   227   228   229   230   231   232   233   234