
Page 217 - Materials Chemistry, Second Edition
P. 217
L1644_C05.fm Page 190 Monday, October 20, 2003 12:02 PM
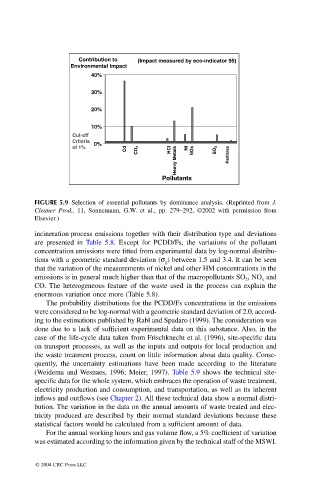
Contribution to (Impact measured by eco-indicator 95)
Environmental Impact
40%
30%
20%
10%
Cut-off
Criteria
0% Z
of 1% Cd CO 2 HCl Ni NOx SO 2
Heavy Metals Particles
Pollutants
FIGURE 5.9 Selection of essential pollutants by dominance analysis. (Reprinted from J.
Cleaner Prod., 11, Sonnemann, G.W. et al., pp. 279–292, ©2002 with permission from
Elsevier.)
incineration process emissions together with their distribution type and deviations
are presented in Table 5.8. Except for PCDD/Fs, the variations of the pollutant
concentration emissions were fitted from experimental data by log-normal distribu-
tions with a geometric standard deviation (s ) between 1.5 and 3.4. It can be seen
g
that the variation of the measurements of nickel and other HM concentrations in the
emissions is in general much higher than that of the macropollutants SO , NO and
x
2
CO. The heterogeneous feature of the waste used in the process can explain the
enormous variation once more (Table 5.8).
The probability distributions for the PCDD/Fs concentrations in the emissions
were considered to be log-normal with a geometric standard deviation of 2.0, accord-
ing to the estimations published by Rabl and Spadaro (1999). The consideration was
done due to a lack of sufficient experimental data on this substance. Also, in the
case of the life-cycle data taken from Frischknecht et al. (1996), site-specific data
on transport processes, as well as the inputs and outputs for local production and
the waste treatment process, count on little information about data quality. Conse-
quently, the uncertainty estimations have been made according to the literature
(Weidema and Wesnaes, 1996; Meier, 1997). Table 5.9 shows the technical site-
specific data for the whole system, which embraces the operation of waste treatment,
electricity production and consumption, and transportation, as well as its inherent
inflows and outflows (see Chapter 2). All these technical data show a normal distri-
bution. The variation in the data on the annual amounts of waste treated and elec-
tricity produced are described by their normal standard deviations because these
statistical factors would be calculated from a sufficient amount of data.
For the annual working hours and gas volume flow, a 5% coefficient of variation
was estimated according to the information given by the technical staff of the MSWI.
© 2004 CRC Press LLC