
Page 215 - Materials Chemistry, Second Edition
P. 215
L1644_C05.fm Page 188 Monday, October 20, 2003 12:02 PM
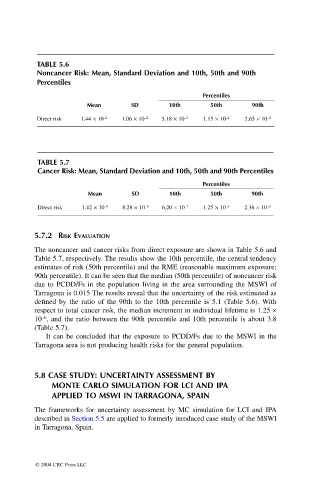
TABLE 5.6
Noncancer Risk: Mean, Standard Deviation and 10th, 50th and 90th
Percentiles
Percentiles
Mean SD 10th 50th 90th
Direct risk 1.44 ¥ 10 –2 1.06 ¥ 10 –2 5.18 ¥ 10 –3 1.15 ¥ 10 –2 2.65 ¥ 10 –2
TABLE 5.7
Cancer Risk: Mean, Standard Deviation and 10th, 50th and 90th Percentiles
Percentiles
Mean SD 10th 50th 90th
Direct risk 1.42 ¥ 10 –6 8.28 ¥ 10 –6 6.20 ¥ 10 –7 1.25 ¥ 10 –6 2.36 ¥ 10 –6
5.7.2 RISK EVALUATION
The noncancer and cancer risks from direct exposure are shown in Table 5.6 and
Table 5.7, respectively. The results show the 10th percentile, the central tendency
estimates of risk (50th percentile) and the RME (reasonable maximum exposure;
90th percentile). It can be seen that the median (50th percentile) of noncancer risk
due to PCDD/Fs in the population living in the area surrounding the MSWI of
Tarragona is 0.015 The results reveal that the uncertainty of the risk estimated as
defined by the ratio of the 90th to the 10th percentile is 5.1 (Table 5.6). With
respect to total cancer risk, the median increment in individual lifetime is 1.25 ¥
–6
10 , and the ratio between the 90th percentile and 10th percentile is about 3.8
(Table 5.7).
It can be concluded that the exposure to PCDD/Fs due to the MSWI in the
Tarragona area is not producing health risks for the general population.
5.8 CASE STUDY: UNCERTAINTY ASSESSMENT BY
MONTE CARLO SIMULATION FOR LCI AND IPA
APPLIED TO MSWI IN TARRAGONA, SPAIN
The frameworks for uncertainty assessment by MC simulation for LCI and IPA
described in Section 5.5 are applied to formerly inroduced case study of the MSWI
in Tarragona, Spain.
© 2004 CRC Press LLC