
Page 212 - Materials Chemistry, Second Edition
P. 212
L1644_C05.fm Page 185 Monday, October 20, 2003 12:02 PM
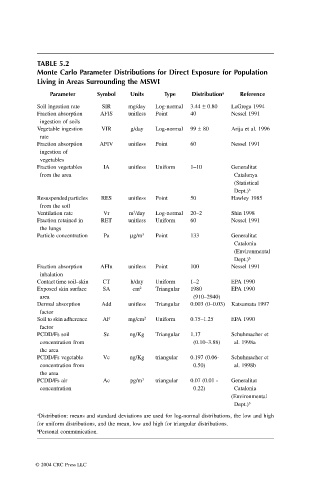
TABLE 5.2
Monte Carlo Parameter Distributions for Direct Exposure for Population
Living in Areas Surrounding the MSWI
Parameter Symbol Units Type Distribution a Reference
Soil ingestion rate SIR mg/day Log-normal 3.44 ± 0.80 LaGrega 1994
Fraction absorption AFIS unitless Point 40 Nessel 1991
ingestion of soils
Vegetable ingestion VIR g/day Log-normal 99 ± 80 Arija et al. 1996
rate
Fraction absorption AFIV unitless Point 60 Nessel 1991
ingestion of
vegetables
Fraction vegetables IA unitless Uniform 1–10 Generalitat
from the area Catalunya
(Statistical
Dept.) b
Resuspended particles RES unitless Point 50 Hawley 1985
from the soil
3
Ventilation rate Vr m /day Log-normal 20–2 Shin 1998
Fraction retained in RET unitless Uniform 60 Nessel 1991
the lungs
Particle concentration Pa mg/m 3 Point 133 Generalitat
Catalonia
(Environmental
Dept.) b
Fraction absorption AFIn unitless Point 100 Nessel 1991
inhalation
Contact time soil–skin CT h/day Uniform 1–2 EPA 1990
Exposed skin surface SA cm 2 Triangular 1980 EPA 1990
area (910–2940)
Dermal absorption Add unitless Triangular 0.003 (0–0.03) Katsumata 1997
factor
Soil to skin adherence AF mg/cm 2 Uniform 0.75–1.25 EPA 1990
factor
PCDD/Fs soil Sc ng/Kg Triangular 1.17 Schuhmacher et
concentration from (0.10–3.88) al. 1998a
the area
PCDD/Fs vegetable Vc ng/Kg triangular 0.197 (0.06- Schuhmacher et
concentration from 0.50) al. 1998b
the area
PCDD/Fs air Ac pg/m 3 triangular 0.07 (0.01 - Generalitat
concentration 0.22) Catalonia
(Environmental
Dept.) b
a Distribution: means and standard deviations are used for log-normal distributions, the low and high
for uniform distributions, and the mean, low and high for triangular distributions.
b Personal communication.
© 2004 CRC Press LLC