
Page 309 - Materials Chemistry, Second Edition
P. 309
L1644_C07.fm Page 281 Monday, October 20, 2003 12:10 PM
1000
900 I Agglomerated
Population density [Persons/km 2 ] 600 II Agglomerated
800
700
-urban
500
-rural
400
300
200
100
0
0 20 40 60 80 100
Radius [km]
1000
900 III Rural
Population density [Persons/km 2 ] 600 -Central City
800
700
500
IV Rural
400
-Rural
300
200
100
0
0 20 40 60 80 100
Radius [km]
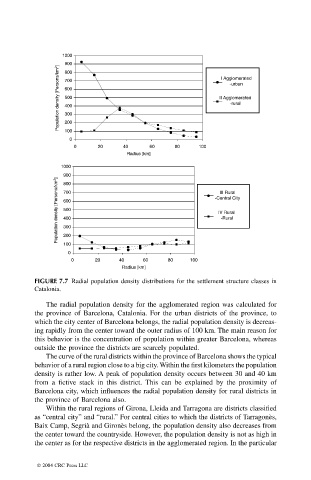
FIGURE 7.7 Radial population density distributions for the settlement structure classes in
Catalonia.
The radial population density for the agglomerated region was calculated for
the province of Barcelona, Catalonia. For the urban districts of the province, to
which the city center of Barcelona belongs, the radial population density is decreas-
ing rapidly from the center toward the outer radius of 100 km. The main reason for
this behavior is the concentration of population within greater Barcelona, whereas
outside the province the districts are scarcely populated.
The curve of the rural districts within the province of Barcelona shows the typical
behavior of a rural region close to a big city. Within the first kilometers the population
density is rather low. A peak of population density occurs between 30 and 40 km
from a fictive stack in this district. This can be explained by the proximity of
Barcelona city, which influences the radial population density for rural districts in
the province of Barcelona also.
Within the rural regions of Girona, Lleida and Tarragona are districts classified
as “central city” and “rural.” For central cities to which the districts of Tarragonès,
Baix Camp, Segrià and Gironès belong, the population density also decreases from
the center toward the countryside. However, the population density is not as high in
the center as for the respective districts in the agglomerated region. In the particular
© 2004 CRC Press LLC