Page 311 - Materials Chemistry, Second Edition
P. 311

L1644_C07.fm  Page 283  Monday, October 20, 2003  12:10 PM


                                    exposure must be subtracted from the calculated population exposure. Because the
                                    short-range population exposure is calculated using the BEEST software, the pop-
                                    ulation exposure within the radius of 100 km from the stack must be subtracted as
                                    well. For this purpose, the population exposure of the emission cell as well as the
                                    population exposure of part of the adjacent cells is subtracted.
                                       After summing up the population exposure of each grid cell and subtracting the
                                    background and the short-range exposure, the sum is divided by the emitted mass.
                                    The result is the population exposure per mass of emitted pollutant for the long-
                                    range transport I   for each pollutant, emission cell and stack height considered.
                                                  far
                                    Because the modeling area is comparatively small (which explains the existence of
                                    only eight emission cells), the long-range exposure per mass of emitted pollutant
                                    does not differ very much for the considered emission cells. The variation coefficient
                                    for the different emission cells lies between 7.75 and 23.49%. Therefore, an average
                                    Catalonian value is calculated for every pollutant and every stack height and applied
                                    as I  for the whole of Catalonia.
                                       far
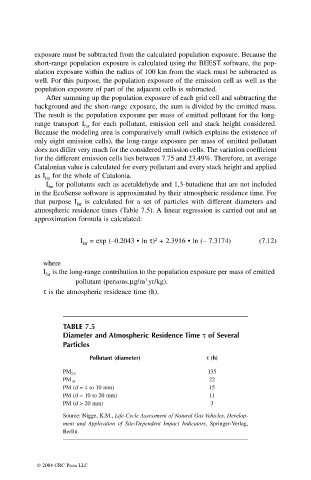
                                       I  for pollutants such as acetaldehyde and 1,3-butadiene that are not included
                                        far
                                    in the EcoSense software is approximated by their atmospheric residence time. For
                                    that purpose I   is calculated for a set of particles with different diameters  and
                                                far
                                    atmospheric residence times (Table 7.5). A linear regression is carried out and an
                                    approximation formula is calculated:


                                                I  = exp (–0.2043 • ln t)  + 2.3916 • ln (– 7.3174)   (7.12)
                                                                     2
                                                 far
                                      where
                                      I  is the long-range contribution to the population exposure per mass of emitted
                                       far
                                                                  3
                                               pollutant (persons.mg/m yr/kg).
                                                                   .
                                      t is the atmospheric residence time (h).


                                            TABLE 7.5
                                            Diameter and Atmospheric Residence Time t of Several
                                            Particles
                                                   Pollutant (diameter)            t (h)
                                                                                    135
                                            PM 2.5
                                                                                    22
                                            PM 10
                                            PM (d = 4 to 10 mm)                     15
                                            PM (d = 10 to 20 mm)                    11
                                            PM (d > 20 mm)                           3
                                            Source: Nigge, K.M., Life-Cycle Assessment of Natural Gas Vehicles, Develop-
                                            ment and  Application of Site-Dependent Impact Indicators, Springer-Verlag,
                                            Berlin.


                                    © 2004 CRC Press LLC
   306   307   308   309   310   311   312   313   314   315   316