
Page 313 - Materials Chemistry, Second Edition
P. 313
L1644_C07.fm Page 285 Monday, October 20, 2003 12:10 PM
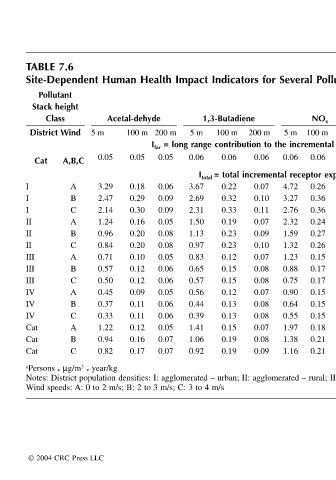
Site-Dependent Human Health Impact Indicators for Several Pollutants and Stack Heights a
NO x PM 10 PM 2.5 SO 2 200 m 100 m 5 m 200 m 100 m 5 m 200 m 100 m 5 m 200 m 100 m I far = long range contribution to the incremental receptor exposure per mass of pollutant 0.06 0.06 0.06 0.60 0.60 0.60 0.18 0.18 0.17 0.06 0.06 I total = total incremental receptor exposure per mass of pollutant 0.09 0.
5 m 0.06 4.72 3.27 2.76 2.32 1.59 1.32 1.23 0.88 0.75 0.90 0.64 0.55 1.97 1.38 1.16 Notes: District population densities: I: agglomerated – urban; II: agglomerated – rural; III: rural – central city; IV: rural – rural; Cat: Catalonian average.
200 m 0.06 0.07 0.10 0.11 0.07 0.09 0.10 0.07 0.08 0.08 0.07 0.08 0.08 0.07 0.08 0.09
1,3-Butadiene 100 m 0.06 0.22 0.32 0.33 0.19 0.23 0.23 0.12 0.15 0.15 0.12 0.13 0.13 0.15 0.19 0.19
5 m 0.06 3.67 2.69 2.31 1.50 1.13 0.97 0.83 0.65 0.57 0.56 0.44 0.39 1.41 1.06 0.92
200 m 0.05 0.06 0.09 0.09 0.05 0.08 0.08 0.05 0.06 0.06 0.05 0.06 0.06 0.05 0.07 0.07
Acetal-dehyde 100 m 0.05 0.18 0.29 0.30 0.16 0.20 0.20 0.10 0.12 0.12 0.09 0.11 0.11 0.12 0.16 0.17 Wind speeds: A: 0 to 2 m/s; B: 2 to 3 m/s; C: 3 to 4 m/s
5 m 0.05 3.29 2.47 B 2.14 C 1.24 0.96 B 0.84 C 0.71 0.57 B 0.50 C 0.45 0.37 B 0.33 C 1.22 0.94 B 0.82 C
TABLE 7.6 Pollutant Stack height Class District Wind A,B,C Cat A I I I A II II II A III III III A IV IV IV A Cat Cat Cat a Persons * mg/m 3 * year/kg © 2004 CRC Press LLC