
Page 318 - Materials Chemistry, Second Edition
P. 318
L1644_C07.fm Page 289 Monday, October 20, 2003 12:10 PM
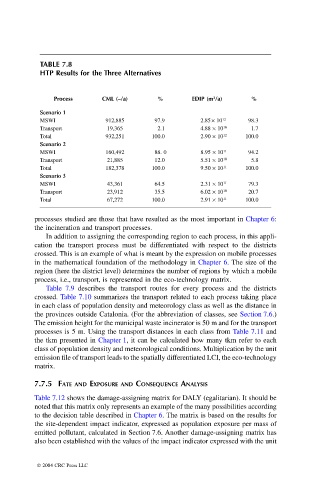
TABLE 7.8
HTP Results for the Three Alternatives
3
Process CML (–/a) % EDIP (m /a) %
Scenario 1
MSWI 912,885 97.9 2.85 ¥ 10 12 98.3
Transport 19,365 2.1 4.88 ¥ 10 10 1.7
Total 932,251 100.0 2.90 ¥ 10 12 100.0
Scenario 2
MSWI 160,492 88. 0 8.95 ¥ 10 11 94.2
Transport 21,885 12.0 5.51 ¥ 10 10 5.8
Total 182,378 100.0 9.50 ¥ 10 11 100.0
Scenario 3
MSWI 43,361 64.5 2.31 ¥ 10 11 79.3
Transport 23,912 35.5 6.02 ¥ 10 10 20.7
Total 67,272 100.0 2.91 ¥ 10 11 100.0
processes studied are those that have resulted as the most important in Chapter 6:
the incineration and transport processes.
In addition to assigning the corresponding region to each process, in this appli-
cation the transport process must be differentiated with respect to the districts
crossed. This is an example of what is meant by the expression on mobile processes
in the mathematical foundation of the methodology in Chapter 6. The size of the
region (here the district level) determines the number of regions by which a mobile
process, i.e., transport, is represented in the eco-technology matrix.
Table 7.9 describes the transport routes for every process and the districts
crossed. Table 7.10 summarizes the transport related to each process taking place
in each class of population density and meteorology class as well as the distance in
the provinces outside Catalonia. (For the abbreviation of classes, see Section 7.6.)
The emission height for the municipal waste incinerator is 50 m and for the transport
processes is 5 m. Using the transport distances in each class from Table 7.11 and
the tkm presented in Chapter 1, it can be calculated how many tkm refer to each
class of population density and meteorological conditions. Multiplication by the unit
emission file of transport leads to the spatially differentiated LCI, the eco-technology
matrix.
7.7.5 FATE AND EXPOSURE AND CONSEQUENCE ANALYSIS
Table 7.12 shows the damage-assigning matrix for DALY (egalitarian). It should be
noted that this matrix only represents an example of the many possibilities according
to the decision table described in Chapter 6. The matrix is based on the results for
the site-dependent impact indicator, expressed as population exposure per mass of
emitted pollutant, calculated in Section 7.6. Another damage-assigning matrix has
also been established with the values of the impact indicator expressed with the unit
© 2004 CRC Press LLC