
Page 317 - Materials Chemistry, Second Edition
P. 317
L1644_C07.fm Page 288 Monday, October 20, 2003 12:10 PM
7.7.2 LCI ANALYSIS
In order to obtain the LCI data of this abbreviated waste incinerator process chain,
3
the volume flow (Nm /a) of the waste incineration plant is multiplied by the unit
emission files for the waste incinerator in the different cases, and the overall transport
(tkm) is multiplied with the unit emission files for the transport. These unit emission
3
files provide the emission of different air pollutants per Nm and per tkm, respec-
tively. The previously mentioned data and the unit emission files for SIRUSA can
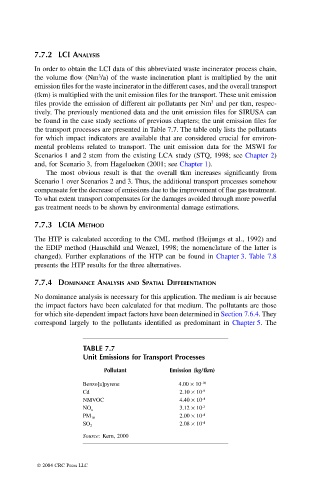
be found in the case study sections of previous chapters; the unit emission files for
the transport processes are presented in Table 7.7. The table only lists the pollutants
for which impact indicators are available that are considered crucial for environ-
mental problems related to transport. The unit emission data for the MSWI for
Scenarios 1 and 2 stem from the existing LCA study (STQ, 1998; see Chapter 2)
and, for Scenario 3, from Hagelueken (2001; see Chapter 1).
The most obvious result is that the overall tkm increases significantly from
Scenario 1 over Scenarios 2 and 3. Thus, the additional transport processes somehow
compensate for the decrease of emissions due to the improvement of flue gas treatment.
To what extent transport compensates for the damages avoided through more powerful
gas treatment needs to be shown by environmental damage estimations.
7.7.3 LCIA METHOD
The HTP is calculated according to the CML method (Heijungs et al., 1992) and
the EDIP method (Hauschild and Wenzel, 1998; the nomenclature of the latter is
changed). Further explanations of the HTP can be found in Chapter 3. Table 7.8
presents the HTP results for the three alternatives.
7.7.4 DOMINANCE ANALYSIS AND SPATIAL DIFFERENTIATION
No dominance analysis is necessary for this application. The medium is air because
the impact factors have been calculated for that medium. The pollutants are those
for which site-dependent impact factors have been determined in Section 7.6.4. They
correspond largely to the pollutants identified as predominant in Chapter 5. The
TABLE 7.7
Unit Emissions for Transport Processes
Pollutant Emission (kg/tkm)
Benzo[a]pyrene 4.00 ¥ 10 -10
Cd 2.10 ¥ 10 -9
NMVOC 4.40 ¥ 10 -4
3.12 ¥ 10 -3
NO x
2.00 ¥ 10 -4
PM 10
2.08 ¥ 10 -4
SO 2
Source: Kern, 2000
© 2004 CRC Press LLC