
Page 212 - Integrated Wireless Propagation Models
P. 212
190 C h a p t e r F o u r
4.2. 1.2 The Basic ModeP
The microcell model is used for a distance of up to 1 km or 1 mile. When the size of a
cell is small, less than 1 km, the street orientation and individual blocks make a differ
ence in signal reception. These buildings that directly affect the received signal strength
level are taken into account for the path loss. Although the strong received signal at the
mobile unit is coming from the multipath reflected waves outside the buildings, not
from the waves penetrating through the buildings, there is a correlation between the
attenuation of the signal and the number of building blocks along the radio path. The
larger the number of building blocks with the size of the blocks, the higher the attenua
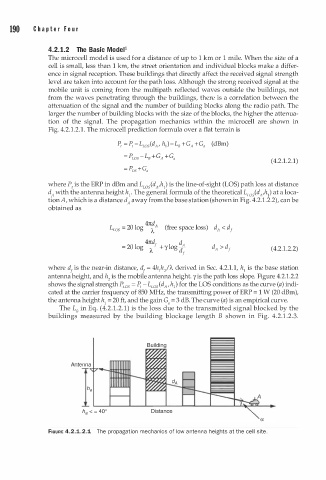
tion of the signal. The propagation mechanics within the microcell are shown in
.
Fig. 4.2 1 . 2.1. The microcell prediction formula over a flat terrain is
(4.2.1.2.1)
= P o + G a
s
where P, is the ERP in dBm and L w 5(d ,h1) is the line-of-sight (LOS) path loss at distance
A
d with the antenna height h • The general formula of the theoretical L w 5(d ,h1) at a loca
1
A
A
tion A, which is a distance d away from the base station (shown in Fig. 4.2.1.2.2), can be
A
obtained as
1 ) d d
L - 20 1 og - ee space oss A < 1
4rcd A (fr
ws -
A-
4rcd d
= 20 logy +y l og / (4.2.1.2.2)
f
where d is the near-in distance, d = 4h hzf'A derived in Sec. 4.2.1.1, h is the base station
1
1
1
1
antenna height, and h is the mobile antenna height. y is the path loss slope. Figure 4.2.1.2.2
2
shows the signal strength P w s = � - Lw 5 (d A , h1) for the LOS conditions as the curve (a) indi
cated at the carrier frequency of 850 MHz, the transmitting power of ERP = 1 W (20 dBm),
the antenna height h = 2 0 ft, and the gain G = 3 dB. The curve (a) is an empirical curve.
1
a
The L8 in Eq. (4. . 1 . 2 . 1 ) is the loss due to the transmitted signal blocked by the
2
buildings measured by the building blockage length B shown in Fig. 4 . 2 . 1 .2.3.
Antenna
}W
a
�
a
FIGURE 4.2.1.2.1 The propagation mechanics of low n tenna heights at the ce l site.
l
a