
Page 213 - Integrated Wireless Propagation Models
P. 213
I
M i c r o c e I P r e d i c t i o n M o d e I s 191
Computational model
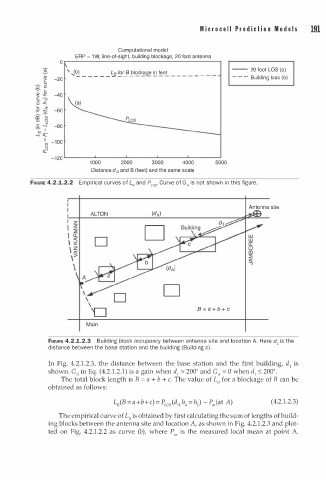
ERP = 1 W , line-of-sight, building blockage, 20 foot antenna
0 �----------------------------------------�
_ '=.§ � -- 20 foot LOS (a)
' .J � _ _ _ _ f5: r� �� ��g � � e.!_ _ _ _ _ _ _ _ _
- - - Building loss (b)
-120 �------L-------L-------�------�------�
1 0 00 2000 3000 4000 5000
Distance dA and B (feet) and the same scale
FIGURE 4.2.1.2.2 Empirical curves of L8 and Pws· Curve of GA is not shown n this figure.
i
Antenna site
D
D
D
\ D
\
B = a + b + C
'D
Main
FIGURE 4.2.1.2.3 Building block occupancy between antenna site and location A. Here d is the
1
distance between the base station and the building (Building c).
In Fig. 4.2.1.2.3, the distance between the base station and the first building, d1 is
shown. GA in Eq. (4.2.1.2.1) is a gain when d1 > 200' and G A = 0 when d1 � 200'.
The total block length is B = a + b + c. The value of L8 for a blockage of B can be
obtained as follows:
(4.2.1.2.3)
The empirical curve of L8 is obtained by first calculating the sum of lengths of build
ing blocks between the antenna site and location A, as shown in Fig. 4.2.1.2.3 and plot
ted on Fig. 4.2.1.2.2 as curve (b), where Pas is the measured local mean at point A.