
Page 215 - Integrated Wireless Propagation Models
P. 215
I
M i c r o c e I P r e d i c t i o n M o d e I s 193
20.0
0.0 I Measured --o--o--o-�
-20.0 I� Predicted
E -40.0 [':3
co � yf \\ � �
"0 -60.0 I'W '>h.
-80.0 �niJ 1\ � I� �
-100.0 � �0 b � f) 'Q
UJCCo. �
-120.0
0.0 0.2 0.4 0.6 0.8 1.0 1.2 1.4
Miles
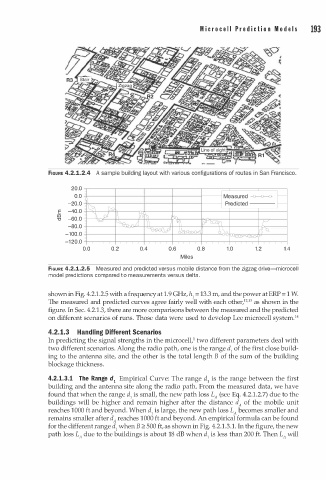
FIGURE 4.2.1.2.5 Measured and predicted versus mobile distance from the zigzag drive-microce l l
model predictions compared o measurements versus delta.
t
shown in Fig. 4.2.1.2.5 with a frequency at 1.9 GHz, h = 13.3 m, and the power at ERP = 1 W.
1
l21
The measured and predicted curves agree fairly well with each other, · 3 as shown in the
figure. In Sec. 4.2.1.3, there are more comparisons between the measured and the predicted
1
on different scenarios of runs. Those data were used to develop Lee microcell system. 4
4.2. 1.3 Handling Different Scenarios
In predicting the signal strengths in the microcelV two different parameters deal with
two different scenarios. Along the radio path, one is the range d of the first close build
1
ing to the antenna site, and the other is the total length B of the sum of the building
blockage thickness.
4.2.1.3.1 The Range d1 Empirical Curve: The range d is the range between the first
1
building and the antenna site along the radio path. From the measured data, we have
found that when the range d is small, the new path loss L (see Eq. 4.2.1.2.7) due to the
1
A
buildings will be higher and remain higher after the distance d of the mobile unit
A
reaches 1000 ft and beyond. When d is large, the new path loss L becomes smaller and
1
A
remains smaller after d A reaches 1000 ft and beyond. An empirical formula can be found
1
for the different range d when B � 500 ft, as shown in Fig. 4.2. . 3.1. In the figure, the new
1
path loss L due to the buildings is about 18 dB when d is less than 200 ft. Then L will
1
A
A