
Page 219 - Integrated Wireless Propagation Models
P. 219
I
M i c r o c e I P r e d i c t i o n M o d e I s 197
Buildings B = a + b + C + d + • • •
ill
"'C
c
=
<( 20
-.1
�------ d 1 � 2 00 ft
�---- 400 ft
1 0
�----- 600 ft
1 0 0 200 300 400 500
Blockage B (in feet)
B
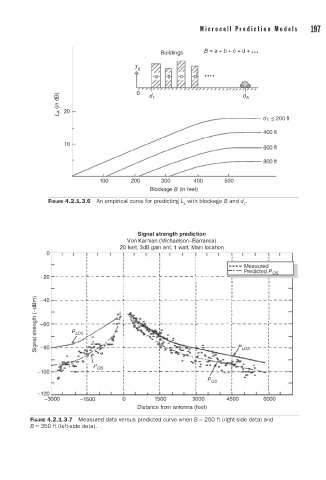
FIGURE 4.2.1.3.6 An empirical curve for predicting L. with blockage a nd d1.
Signal strength prediction
Von Karman (Michaelson-Barranca)
20 feet, 3dB gain ant, 1 watt, Main location
'
I
I
I · · • • Measured
1 1 1 1 - · - Predicted P
-20 - - - - - - L - - - - - - L - I - - - - - L - - - - - - L - - - - - -
1
I
I
I
I
I
I I I o
E' -4o
I
cc - - - - - - � 1 - - - - - - � - i - - - - - � - - - - - - � - - - - - - � - - - - - - � - - -
"'C I I I
--!... : "0� : :
.r: I I • . • I
� -60
� - - - : - - - - - t - -
iil - - --P�a: t - - - ;t-� - - r - .- - - - - f - - -
-
-
Cii L l o � I ,. Q. • : : :
c I O D .:..... I �'l;tct D • I L PLos· I
I
""
0 -80 _ _ _ _ _ .r..-� _ _ _ L _ 1 _ _ _ _ _ li::-- - ---= • ..:, _ _ _ _ - I _ - - L I - - -
II' .......... ,._
I
... . .._
�� ""11 <Q
0 'l' .f' I I • -r.• ' I 0 41 I I
0 • I I � • ol._ llo ._ .1" I
. �·...-;. ' \ I I I : o .... • ·-k_J. :J. I I
•
;a--'. - • p I •-;' • � • 0
.:-�-.:t--!.. �----� - - -
- 1 0 0 _a8 _J7D ·-- - � - _9� - - - ; - - - - - - t- - - - - - - �· - -
1 I I I I • • I
: : : : Pos : • :
I I I I I I
I I I I I I
Distance from antenna (feet)
FIGURE 4.2.1.3.7 Measured data versus predicted curve when B 2 00 ft (right-side data) and
=
B = 350 ft (left-side data).