
Page 224 - Integrated Wireless Propagation Models
P. 224
202 C h a p t e r F o u r
base and yet with limited gain in prediction accuracy, especially when applied to the
whole city. However, based on the drive tests conducted in many cities, it appears that
building height does not play a critical role in the accuracy of the model, as in most
cases antenna height is about the same or just a bit higher than the surrounding build
ings to ensure that the coverage is within 1 km. This is another benefit of the Lee micro
cell model, as it simplifies a 3D problem to a 2D one without sacrificing accuracy.
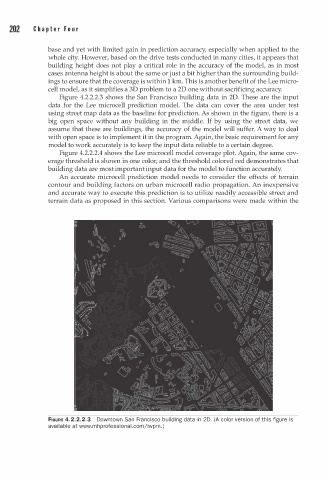
Figure 4.2.2.2.3 shows the San Francisco building data in 2D. These are the input
data for the Lee microcell prediction model. The data can cover the area under test
using street map data as the baseline for prediction. As shown in the figure, there is a
big open space without any building in the middle. If by using the street data, we
assume that these are buildings, the accuracy of the model will suffer. A way to deal
with open space is to implement it in the program. Again, the basic requirement for any
model to work accurately is to keep the input data reliable to a certain degree.
Figure 4.2.2.2.4 shows the Lee microcell model coverage plot. Again, the same cov
erage threshold is shown in one color, and the threshold colored red demonstrates that
building data are most important input data for the model to function accurately.
An accurate microcell prediction model needs to consider the effects of terrain
contour and building factors on urban microcell radio propagation. An inexpensive
and accurate way to execute this prediction is to utilize readily accessible street and
terrain data as proposed in this section. Various comparisons were made within the
FIGURE 4.2.2.2.3 Downtown San Francisco building data in 20. (A color version of this figure is
a
av i lable at www.mhprofessional.comjiwpm. )