
Page 222 - Integrated Wireless Propagation Models
P. 222
200 C h a p t e r F o u r
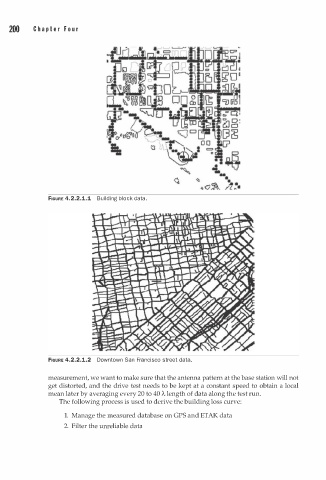
FIGURE 4.2.2.1.1 Building block data.
FIGURE 4.2.2.1.2 Downtown San Francisco street data.
measurement, we want to make sure that the antenna pattern at the base station will not
get distorted, and the drive test needs to be kept at a constant speed to obtain a local
mean later by averaging every 20 to 40 "A length of data along the test run.
The following process is used to derive the building loss curve:
1. Manage the measured database on GPS and ETAK data
2. Filter the umeliable data