
Page 218 - Integrated Wireless Propagation Models
P. 218
196 C h a p t e r F o u r
Signal strength prediction
Jamboree (Barranca-Michaelson)
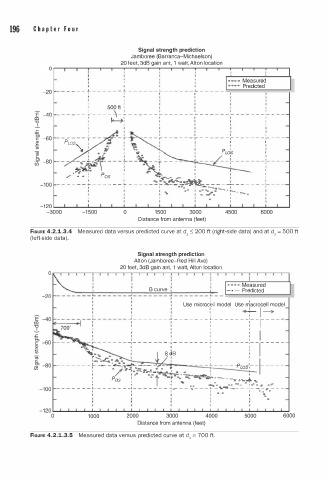
20 feet, 3dB gain ant, 1 watt, Alton location
Measured
+++-+ Predicted
-20 - - - - - - 1... - 1 - - - - _ ..1.. - - - - - - L - I - - - - - L I - - - - - _!::------------'
t
I
I I
I
I
500 ft I I I
I I I
E' -4o - - - - - - � - - - - � - � - - - - - - � - - - - - - � - - - - - - � - - - - - -� - - -
[!)
"0 : �: ! : : :
-2.- I I I I I I I
.r: I
0, - - - - - - r - I - I I I t
c -60 - - - r - - - - - - r - - - - - - r - - - - - - r -
� Pws : : 1
t5 '\
Cii 1 1 .a 1 1 Pu)s 1
c
� -80
�:;e�1-- - t- - � gg --r--- - �---/- - ;-- - - - --;--- -
� q J p I p ! : :
./ "' 8 : OS : ,. �.. .,- f 1 1
�
-100 - - - - - - � - 1 - - - - - L - - - - - � � �� � aaa a• ; 0:- ._, --: -- • � - - - - � - - -
-
- � - -
-
-
-
I
!
�
Ciao ""' ';_,OQ I • --
1
I
Distance from antenna (feet)
FIGURE 4.2.1.3.4 Measured data versus predicted curve at d1 :::; 200 ft (right-side data) and at d1 = 500 ft
(left-side data).
Signal strength prediction
Alton (Jamboree-Red Hill Ave)
20 feet, 3dB gain ant, 1 watt, Alton location
Measured
1 1 B curve 1 1 - · - Predicted
- - - - - - - � - - - - - - � - - - - - - - � - - - - - - - L - - �
I I I I
m
e
Use microc ll model Use acrocell model
+ I �
-
� J I I -: - -� - - - -
-;�'- - - - : - - - - - - : - - - - - - - : - - - - - - - : - - - - - -
0 I I I l I
I I I I
:
-
.r: v \:. - - - - - � - - - - -� -� ��- - - - - -f - - - - - - -;-- �- - - - -
I
I
I
I
I
g> -60
�
t5
Cii f -..., �• I t I I 1
-
c - -p- _;_ 1- - - - -
Ol - - - - _ _ _ t<_·-���v!._.._ ___ � - I - - - � - - -
i:i5 1 a / . .. �.:;"• ....=..r.,...:._ •. • � LOS !
1
I I rJ1 o a ./).. � 1-;f • · � .. � I
: Pas : -r &�. ... ... IIIII\, • : - --u "" .... o� ....
•
I I � 1 I ....._. ""' .. • -. .,. I J" D lfl
-�
- - - - - - - .._ - - - - - - -.t - - - - - - - -4 � - - -. - a u - - � - '"'� -- - - · - - - tr' - - -
I I I I I 11 D 0
I I I • • .,
I
I
Distance from antenna (feet)
FIGURE 4.2.1.3.5 Measured data versus predicted curve at d1 = 700 ft.